DOW-UAP-D175, Selbsteinschätzung von BAASS zu ihren UAP-Analysefähigkeiten, November 2010
Kerndaten
- Offizielle Akten-ID
- DOW-UAP-D175
- Dokumenttyp
- Dokument
- Behörde
- Department of War
- Veröffentlicht in
- R07 · 2026-10-23
- Datum des Vorfalls
- 11/23/10
- Ort des Vorfalls
- Las Vegas, Nevada
- Koordinaten
- 36.1674263, -115.1484131
- Lesbare Seiten
- 104/141
- VIRIN
- 260508-D-D0360-1167
Offizielle Beschreibung
Diese vom Auftragnehmer Bigelow Aerospace Advanced Space Studies (BAASS) verfasste Fähigkeitsdarstellung vom November 2010 präsentiert die Analysearbeit von BAASS als technisch fundiert und strategisch wertvoll. Das Dokument scheint nicht nur die analytischen Fähigkeiten von BAASS beschreiben, sondern auch die Argumente für die weitere Relevanz der Organisation und die Fortführung von AAWSAP stärken zu sollen. Es fasst die Selbsteinschätzung des Unternehmens zur Eignung seines Personals, seiner Software, seiner Ausrüstung, seiner Feldsensoren und seiner Data-Warehousing-Kapazitäten für die Analyse unidentifizierter Luftphänomene (UAP) und unidentifizierter Unterwasserobjekte (USO) zusammen. Es enthält Auszüge aus Fallbefunden und nutzt ausgewählte Fallstudien und Modellierungsübungen als Nachweis der analytischen Fähigkeiten von BAASS. Der Bericht beschreibt BAASS als Organisation, die Ressourcen zur Datenerhebung im Feld, historische Datenbanken und Rechenwerkzeuge wie ANSYS Multiphysics kombiniert, um UAP-Vorfälle mit ingenieur- und physikwissenschaftlichen Analysen zu modellieren, einschließlich Arbeiten zu Radarquerschnitt, Strömungsverhalten, Akustik und aerodynamischer Leistung. Zudem stellt er die internen Fähigkeiten von BAASS als Beitrag sowohl zur Bedrohungsbewertung als auch zur Erforschung fortgeschrittener Luft- und Raumfahrttechnologien dar und behauptet, die Analyse der Leistungsmerkmale von UAP könne künftige Entwicklungen in den Bereichen Antrieb, Tarnung, Detektion und Waffensysteme beeinflussen.
Über diesen Dokumenttyp
Bei diesem Dokument handelt es sich um eine administrative, programmatische oder von einem Auftragnehmer erstellte Unterlage im Zusammenhang mit dem Advanced Aerospace Weapon System Applications Program (AAWSAP), einem von der Defense Intelligence Agency (DIA) verwalteten Programm, das von 2008 bis 2012 aktiv war. Der offizielle Arbeitsumfang von AAWSAP umfasste 12 technische Forschungsbereiche im Zusammenhang mit potenziellen Luft- und Raumfahrtbedrohungen über einen Zeithorizont von mehr als 40 Jahren. Als Teil der umfassenderen Programmunterlagen dokumentiert die Akte, wie AAWSAP zu einem bestimmten Zeitpunkt definiert, organisiert, beauftragt, finanziert, umgesetzt oder beschrieben wurde.
Zum Glossar →✦ KI-Zusammenfassung
Dieser "Summary Report on BAASS UAP Analysis Capabilities" vom 23. November 2010 (141 Seiten) ist eine Selbstbewertung von Bigelow Aerospace Advanced Space Studies (BAASS), das 2008 bis 2010 für das Defense Warning Office der Defense Intelligence Agency im Rahmen des Vertrags HHM402-08-C-0072 eine Organisation aufbaute, die die mit fortgeschrittener Luft- und Raumfahrttechnik verbundene Bedrohung der nationalen Sicherheit untersuchen sollte. Er beschreibt das Personal von BAASS, die Ausrüstung (von Nachtsichtgeräten bis zu Digitalmikroskopen), das Data Warehouse mit UAP-Meldungen und die Ingenieur-Simulationsplattform ANSYS Multiphysics und behandelt historische Projekte wie Project Grudge sowie die Arten gemeldeter UAP-Formen. Kern sind Demonstrationssimulationen: numerische Strömungsmechanik zum "Tic Tac"-Vorfall vom 14. November 2004 mit Flugzeugen der USS Nimitz (Druck, Temperatur und Machzahl um eine zylindrische Form im Maßstab 1:6 bei 100 bis 1.500 mph), ein scheibenförmiges Objekt beim Eintauchen ins Wasser, ein akustisches Modell eines nicht identifizierten Unterwasserobjekts (USO) und ein Radarquerschnittsmodell eines kugelförmigen UAP. Der Bericht stellt sie als Beispiele für die Möglichkeiten der Werkzeuge dar, gibt an, dies sei vermutlich der erste Einsatz eines branchenüblichen Finite-Elemente-Codes für einen UAP-Fall, und merkt an, dass viele, aber nicht alle Sichtungen durch natürliche Phänomene erklärbar sein könnten. Die Simulationen bilden hypothetische Formen und Bedingungen nach; sie sind keine Messungen der beteiligten Objekte.
Mit KI aus der Originaldatei erstellt — kann Fehler enthalten.
▸Transkript(104 von 141 Seiten lesbar)
[PAGE 1] Summary Report on BAASS UAP Analysis Capabilities November 23, 2010 [PAGE 2] Summary Report on BAASSUAP Analysis Capabilities November 23, 2010 [PAGE 3] TABLE OF CONTENTS pg. LIST OF FIGURES ........................................................................................................................ 4 LIST OF TABLES .......................................................................................................................... 9 1. EXECUTIVE SUMMARY ...................................................................................................... 10 2. INTRODUCTION.................................................................................................................... 13 2.1 HISTORICAL EVENTS AND STUDIES ....................................................................... 13 2.2 BAASS' TWELVE TECHNOLOGY FOCUS AREAS .................................................. 14 2.3 BAASS PERSONNEL, SOFTWARE, EQUIPMENT AND DATA WAREHOUSE ................................................................................................................. 15 2.3.1 BAASS Personnel .................................................................................................... 15 2.3.2 ANSYS Multiphysics FEA ...................................................................................... 16 2.3.3 Equipment ................................................................................................................ 16 2.3.4 Data Warehouse ....................................................................................................... 19 3. TYPES OF UAPS OBSERVED .............................................................................................. 21 4. ANALYTICAL AND NUMERICAL SOLUTIONS FOR UAP INVESTIGATIONS ........... 25 4.1 "TIC TAC" INCIDENT .................................................................................................... 25 4.1.1 Analytical Solutions ofVelocities and Accelerations Associated with "Tic Tac" Performance ............................................................................................ 32 4.1 .2 Summary ofAnalytical Velocity and Acceleration Solutions ................................. 32 4.1.3 Numerical Analysis ofCompressible Flow ............................................................. 39 4.1.4 Summary and Conclusions of Compressible Numerical Analyses .......................... 46 4.1.5 Numerical Analysis of Incompressible Flow ofa UAP Entering Water ................. 47 4.1.6 Numerical Analysis of Incompressible Flow ofa UAP Entering Water Results ...................................................................................................................... 48 4.1. 7 Summary and Conclusions ofNumerical Analysis ofIncompressible Flow of a UAP Entering Water Results ............................................................................ 58 4.2 ANALYSES OF SPHERICAL UAPS .............................................................................. 58 4.2.1 Acoustical Analysis ofa Spherical USO ................................................................. 58 4.2.2 ANSYS Multiphysics Electromagnetic Capabilities ............................................... 82 4.2.3 Radar Cross Section Analysis ofa Spherical UFO .................................................. 83 5. SUMMARY AND CONCLUSION......................................................................................... 98 6. REFERENCES ....................................................................................................................... I00 SYMBOLS AND ACRONYMS ................................................................................................ 102 ATTACHMENT 1-ANSYS INPUT FILES ............................................................................. 105 Summary Report on BAASS UAP Analysis Capabilities Page 2 November 23, 2010 [PAGE 4] USO ANSYS Multiphysics Acoustics Input File Example .................................................... 105 ATTACHMENT II - "TIC TAC" CFD CONTOUR PLOTS FOR PRESSURE, ATTACHMENT III - RIGHT CIRCULAR CYLINDER CFD CONTOUR PLOTS UAP ANSYS Multiphysics RCS Input File Example ............................................................ 112 TEMPERATURE AND MACH NUMBER............................................................................... 116 FOR PRESSURE, TEMPERATURE AND MACH NUMBER ................................................ 128 Summary Report on BAASS UAP Analysis Capabilities Page 3 November 23, 2010 [PAGE 5] LIST OF FIGURES pg. Figure 1. The UFO Pattern: A Condensed Statement ofRepeated Observations ........................ 21 Figure 2. Lockheed Martin Skunk Works SR-71 Black Bird ....................................................... 22 Figure 3. Lockheed F-117 Nighthawk Stealth Fighter ................................................................. 22 Figure 4. Northrop Grumman B-2 Spirit Stealth Bomber ............................................................ 23 Figure 5. Boeing Phantom Works B-2 Stealth X-45A UAV ........................................................ 23 Figure 6. Three Dimensional Rendering ofa Cylindrical or "Tic Tac" UAP .............................. 24 Figure 7. Three Dimensional Rendering ofa Metallic Spherical UAP ........................................ 24 Figure 8. Location of the AAV during the F/AI 8 Intercept ......................................................... 26 Figure 9. FLIR in 'White Hot' Mode ............................................................................................ 30 Figure 10. FLIR in "Black I-lot" mode .......................................................................................... 30 Figure 11. Tic Tac Parametric Velocities for Selected Times of Event Duration in ft/sec ......................................................................................................................... 35 Figure 12. Tic Tac Parametric Velocities for Selected Times of Event Duration Figure 14. Tic Tac Parametric Accelerations for Selected Times ofEvent Duration Figure 15. Tic Tac Pressure at I /6 Scale, Air Temperature 223K and 700 mph Figure 16. Tic Tac Temperature at 1 /6 Scale, Air Temperature 223K and 700 mph Figure 17. Tic Tac Mach Number at 1/6 Scale, Air Temperature 223K and 700 mph Figure 18. Tic Tac Pressure at 1/6 Scale, Air Temperature 223K and 1500 mph Figure 19. Tic Tac Temperature at 1/6 Scale, Air Temperature 223K and 1500 mph Figure 20. Tic Tac Mach Number at 1/6 Scale, Air Temperature 223K and 1500 mph Figure 21. Cylinder Temperature at 1/6 Scale, Air Temperature 223K and 700 mph Figure 22. Cylinder Mach Number at 1/6 Scale, Air Temperature 223K and 700 mph Figure 23. Cylinder Pressure at 1/6 Scale, Air Temperature 223K and 1500 mph Figure 24. Cylinder Temperature at 1/6 Scale, Air Temperature 223K and 1500 mph Figure 25. Cylinder Mach Number at 1/6 Scale, Air Temperature 223K and 1500 mph in mph ......................................................................................................................... 36 Figure 13. Tic Tac Parametric Accelerations for Selected Times ofEvent Duration in ft/sec2 ...................................................................................................................... 37 in g .............................................................................................................................. 38 with Mixed Inlet and Supersonic Outlet ..................................................................... 41 with Mixed Inlet and Supersonic Outlet ..................................................................... 41 with Mixed Inlet and Supersonic Outlet.. ................................................................... 42 with Supersonic Inlet and Supersonic Outlet.. ............................................................ 42 with Supersonic Inlet and Supersonic Outlet .............................................................. 43 with Supersonic Inlet and Supersonic Outlet.. ............................................................ 43 with Mixed lnlet and Supersonic Outlet ..................................................................... 44 with Mixed lnlet and Supersonic Outlet ..................................................................... 44 with Supersonic Inlet and Supersonic Outlet.. ............................................................ 45 with Supersonic lnlet and Supersonic Outlet.. ............................................................ 45 with Supersonic Inlet and Supersonic Outlet.. ............................................................ 46 Figure 26. Solid Three Dimensional Geometry ofDisc and Water. ............................................. 50 Figure 27. Solid Three Dimensional Geometry Mesh ofDisc and Water .................................... 51 Figure 28. Solid Three Dimensional Geometry Mesh ofUAP Disc ............................................ 52 Summary Report on BAASS UAP Analysis Capabilities Page4 November 23, 2010 [PAGE 6] Figure 29. User Generated Cut Analysis Plane ............................................................................ 53 Figure 30. Animated Result, Fluid 2 Volume Fraction................................................................ 54 Figure 31. Total Pressure Around UAP ....................................................................................... 55 Figure 32. Water Surface Effects From Solid Impact.. ................................................................ 56 Figure 33. Water Surface Effects From Solid Impact (Side View) .............................................. 57 Figure 34. Mesh Plot for 1,000 Hz with 25 Elements per Wavelength in Water ......................... 61 Figure 35. Mesh Plot for 1,000 Hz with 50 Elements per Wavelength in Water ......................... 62 Figure 36. Contour Plot ofReal Component ofPressure (Pa) for t ,000 Hz with 50 Elements per Wavelength in Water ............................................................... 63 Figure 37. Contour Plot ofReal Component ofPressure (Pa) for 1,000 Hz Figure 38. Contour Plot of Imaginary Component ofPressure (Pa) for 1,000 Hz Figure 39. Contour Plot of the Magnitude ofPressure (Pa) for 1,000 Hz Figure 40. Steady State Real Component of Pressure (Pa) as a Function of Radial Figure 41 . Steady State Imaginary Component of Pressure (Pa) as a Function with 50 Elements per Wavelength in Water ............................................................... 64 with 25 Elements per Wavelength in Water ............................................................... 65 with 25 Elements per Wavelength in Water ............................................................... 66 Distance (m) Plot for 1,000 Hz with 25 Elements per Wavelength in Water. ............ 67 of Radial Distance (m) Plot for 1,000 Hz with 25 Elements per Wavelength in Water ....................................................................................................................... 68 Figure 42. Steady State Magnitude ofPressure (Pa) as a Function ofRadial Figure 43. Contour Plot ofReal Component ofPressure (Pa) for 5,000 Hz Figure 44. Contour Plot of Imaginary Component ofPressure (Pa) for 5,000 Hz Figure 45. Contour Plot of the Magnitude ofPressure (Pa) for 5,000 Hz Figure 46. Steady State Real Component of Pressure (Pa) as a Function Distance (m) Plot for 1,000 Hz with 25 Elements per Wavelength in Water. ............ 69 with 25 Elements per Wavelength in Water ............................................................... 70 with 25 Elements per Wavelength in Water ............................................................... 71 with 25 Elements per Wavelength in Water ............................................................... 72 of Radial Distance (m) Plot for 5,000 Hz with 25 Elements per Wavelength in Water....................................................................................................................... 73 Figure 47. Steady State Imaginary Component ofPressure (Pa) as a Function of Radial Distance (m) Plot for 5,000 Hz with 25 Elements per Wavelength in Water ....................................................................................................................... 74 Figure 48. Steady State Magnitude of Pressure (Pa) as a Function ofRadial Distance (m) Plot for 5,000 Hz with 25 Elements per Wavelength in Water. ............ 75 Figure 49. Contour Plot ofReal Component ofPressure (Pa) for 10,000 Hz Figure 50. Contour Plot ofImaginary Component of Pressure (Pa) for 10,000 Hz Figure 51. Contour Plot ofthe Magnitude ofPressure (Pa) for I 0,000 Hz Figure 52. Steady State Real Component of Pressure (Pa) as a Function with 25 Elements per Wavelength in Water ............................................................... 76 with 25 Elements per Wavelength in Water ............................................................... 77 with 25 Elements per Wavelength in Water ............................................................... 78 ofRadial Distance (m) Plot for 10,000 Hz with 25 Elements per Wavelength in Water....................................................................................................................... 79 Summary Report on BAASS UAP Analysis Capabilities Page 5 November 23, 2010 [PAGE 7] Figure 53. Steady State Imaginary Component ofPressure (Pa) as a Function ofRadial Distance (m) Plot for 10,000 Hz with 25 Elements per Wavelength in Water....................................................................................................................... 80 Figure 54. Steady State Magnitude ofPressure (Pa) as a Function ofRadial Distance (m) Plot for 10,000 Hz with 25 Elements per Wavelength in Water ................................ 81 Figure 55. Factors that Determine the Energy Returned by a Target... ........................................ 83 Figure 56. Effect of Distance from the radar to the Target on the· Power Density ....................... 84 Figure 57. Reduction in the Strength ofTarget Echoes with Range ............................................ 87 Figure 58. Geometry, Description and Maximum RCS .............................................................. 88 Figure 59. Radar Cross Section Comparison ............................................................................... 89 Figure 60. Mesh of½ Symmetry UFO Sphere with 25 Elements per Wavelength ..................... 90 Figure 61. Mesh of ½ Symmetry UFO Sphere with 50 Elements per Wavelength ..................... 91 Figure 62. Normalized radar Cross Section Plot for a ½ Symmetry IO m Metallic Sphere with a 1 m Dielectric Coating in Decibels for 300 MHz and 25 Elements per Wavelength ........................................................................................... 93 Figure 63. Normalized radar Cross Section Plot for a½ Symmetry 10 m Metallic Sphere with a 1 m Dielectric Coating in Decibels for 300 MHz and Figure 64. Electric Filed Contour in V/m for a½ Symmetry 10 m Metallic Sphere 50 Elements per Wavelength ...................................................................................... 95 with a I m Dielectric Coating in Decibels for 300 MHz and 25 Elements per Wavelength ........................................................................................................... 96 Figure 65. Tic Tac Pressure at 1/6 Scale, Air Temperature 223K and 100 mph Figure 66. Tic Tac Temperature at 1/6 Scale, Air Temperature 223K and 100 mph Figure 67. Tic Tac Mach Number at 1/6 Scale, Air Temperature 223K and 100 mph Figure 68. Tic Tac Pressure at 1/6 Scale, Air Temperature 223K and 200 mph Figure 69. Tic Tac Temperature at 1/6 Scale, Air Temperature 223K and 200 mph Figure 70. Tic Tac Mach Number at 1/6 Scale, Air Temperature 223K and 200 mph Figure 71. Tic Tac Pressure at 1/6 Scale, Air Temperature 223K and 300 mph Figure 72. Tic Tac Temperature at 1/6 Scale, Air Temperature 223K and 300 mph Figure 73. Tic Tac Mach Number at 1/6 Scale, Air Temperature 223K and 300 mph Figure 74. Tic Tac Pressure at 1/6 Scale, Air Temperature 223K and 400 mph Figure 75. Tic Tac Temperature at 1/6 Scale, Air Temperature 223K and 400 mph Figure 76. Tic Tac Mach Number at 1/6 Scale, Air Temperature 223K and 400 mph with Subsonic Inlet and Subsonic Outlet.. ................................................................ 116 with Subsonic Inlet and Subsonic Outlet .................................................................. 116 with Subsonic Inlet and Subsonic Outlet.. ................................................................ 11 7 with Subsonic Inlet and Subsonic Outlet.. ................................................................ 117 with Subsonic Inlet and Subsonic Outlet .................................................................. 11 8 with Subsonic Inlet and Subsonic Outlet.................................................................. 118 with Subsonic Inlet and Subsonic Outlet.. ................................................................ 119 with Subsonic Inlet and Subsonic Outlet .................................................................. 119 with Subsonic Inlet and Subsonic Outlet.. ................................................................ 120 with Mixed Inlet and Subsonic Outlet ...................................................................... 120 with Mixed Inlet and Subsonic Outlet ...................................................................... 121 with Mixed Inlet and Subsonic Outlet ...................................................................... 121 .. Summary Report on BAASS UAP Analysis Capabilities Page 6 November 23, 2010 [PAGE 8] Figure 77. Tic Tac Pressure at 1/6 Scale, Air Temperature 223K and 500 mph with Mixed Inlet and Subsonic Outlet ...................................................................... 122 Figure 78. Tic Tac Temperature at 1/6 Scale, Air Temperature 223K and 500 mph Figure 79. Tic Tac Mach Number at 1/6 Scale, Air Temperature 223K and 500 mph Figure 80. Tic Tac Pressure at 1/6 Scale, Air Temperature 223K and 900 mph Figure 81 . Tic Tac Temperature at 1/6 Scale, Air Temperature 223K and 900 mph Figure 82. Tic Tac Mach Number at 1/6 Scale, Air Temperature 223K and 900 mph Figure 83. Tic Tac Pressure at 1/6 Scale, Air Temperature 223K and 1100 mph Figure 84. Tic Tac Temperature at 1/6 Scale, Air Temperature 223K and 1100 mph Figure 85. Tic Tac Mach Number at 1/6 Scale, Air Temperature 223K and 1100 mph Figure 86. Tic Tac Pressure at 1/6 Scale, Air Temperature 223K and 1300 mph Figure 87. Tic Tac Temperature at 1/6 Scale, Air Temperature 223K and 1300 mph Figure 88. Tic Tac Mach Number at 1/6 Scale, Air Temperature 223K and 1300 mph Figure 89. Cylinder Pressure at 1/6 Scale, Air Temperature 223K and 100 mph Figure 90. Cylinder Temperature at 1/6 Scale, Air Temperature 223K and 100 mph Figure 91. Cylinder Mach Number at 1/6 Scale, Air Temperature 223K and 100 mph Figure 92. Cylinder Pressure at 1/6 Scale, Air Temperature 223K and 200 mph Figure 93. Cylinder Temperature at 1/6 Scale, Air Temperature 223K and 200 mph Figure 94. Cylinder Mach Number at 1/6 Scale, Air Temperature 223K and 200 mph Figure 95. Cyljnder Pressure at 1/6 Scale, Arr Temperature 223K and 300 mph Figure 96. Cylinder Temperature at 1/6 Scale, Air Temperature 223K and 300 mph Figure 97. Cylinder Mach Number at 1/6 Scale, Air Temperature 223K and 300 mph Figure 98. Cylinder Pressure at 1/6 Scale, Air Temperature 223K and 400 mph Figure 99. Cylinder Temperature at 1/6 Scale, Air Temperature 223K and 400 mph with Mixed Inlet and Subsonic Outlet ...................................................................... 122 with Mixed Inlet and Subsonic Outlet ...................................................................... 123 with Supersonic Inlet and Supersonic Outlet.. .......................................................... 123 with Supersonic Inlet and Supersonic Outlet ............................................................ 124 with Supersonic Inlet and Supersonic Outlet ............................................................ 124 with Supersonic Inlet and Supersonic Outlet.. .......................................................... 125 with Supersonjc Inlet and Supersonic Outlet ............................................................ 125 with Supersonic Inlet and Supersonic Outlet.. .......................................................... 126 with Supersonic Inlet and Supersonic Outlet.. .......................................................... 126 with Supersonic Inlet and Supersonic Outlet.. .......................................................... 127 with Supersonic Inlet and Supersonic Outlet.. .......................................................... 127 with Subsonic Inlet and Subsonic Outlet.. ................................................................ 128 with Subsonic Inlet and Subsonic Outlet.. ................................................................ 128 with Subsonic Inlet and Subsonic Outlet.. ................................................................ 129 with Subsonic Inlet and Subsonic Outlet.. ................................................................ 129 with Subsonic Inlet and Subsonic Outlet.. ................................................................ 130 with Subsonic Inlet and Subsonic Outlet.. ................................................................ 130 with Subsonic Inlet and Subsonic Outlet.. ................................................................ 131 with Subsonic Inlet and Subsonic Outlet.. ................................................................ 131 with Subsonic Inlet and Subsonic Outlet.. ................................................................ 132 with Subsonic Inlet and Subsonic Outlet.. ................................................................ 132 with Subsonic Inlet and Subsonjc Outlet.. ................................................................ 133 Summary Report on BAASS UAP Analysis Capabilities Page 7 November 23, 2010 [PAGE 9] Figure 100. Cylinder Mach Number at 1/6 Scale, Air Temperature 223K and 400 mph with Subsonic Inlet and Subsonic Outlet.. ............................................................. 133 Figure 101 . Cylinder Pressure at 1/6 Scale, Air Temperature 223K and 500 mph Figure 102. Cylinder Temperature at 1/6 Scale, Air Temperature 223K and 500 mph Figure 103. Cylinder Mach Number at 1/6 Scale, Air Temperature 223K and 500 mph Figure 104. Cylinder Pressure at 1/6 Scale, Air Temperature 223K and 700 mph Figure 105. Cylinder Pressure at 1 /6 Scale, Air Temperature 223K and 900 mph Figure l 06. Cylinder Temperature at 1/6 Scale, Air Temperature 223K and 900 mph Figure 107. Cylinder Mach Number at 1/6 Scale, Air Temperature 223K and 900 mph Figure l 08. Cylinder Pressure at l/6 Scale, Air Temperature 223K and 1100 mph Figure 109. Cylinder Temperature at 1/6 Scale, Air Temperature 223K and 1100 mph Figure 110. Cylinder Mach Number at 1/6 Scale, Air Temperature 223K and 1100 mph Figure 111. Cylinder Pressure at 1 /6 Scale, Air Temperature 223K and 1300 mph Figure 112. Cylinder Temperature at 1 /6 Scale, Air Temperature 223K and 1300 mph Figure 113. Cylinder Mach Number at 1/6 Scale, Air Temperature 223K and 1300 mph with Mixed Inlet and Subsonic Outlet.. ................................................................. 134 with Mixed Inlet and Subsonic Outlet ................................................................... 134 with Mixed Inlet and Subsonic Outlet ................................................................... 135 with Mixed Inlet and Supersonic Outlet.. .............................................................. 135 with Supersonic Inlet and Supersonic Outlet.. ....................................................... 136 with Supersonic Inlet and Supersonic Outlet.. ....................................................... 136 with Supersonic Inlet and Supersonic Outlet.. ....................................................... 137 with Supersonic Inlet and Supersonic Outlet......................................................... 137 with Supersonic Inlet and Supersonic Outlet ......................................................... 138 with Supersonic Inlet and Supersonic Outlet. ........................................................ 138 with Supersonic Inlet and Supersonic Outlet.. ....................................................... 139 with Supersonic Inlet and Supersonic Outlet.. ....................................................... 139 with Supersonic Inlet and Supersonic Outlet.. ....................................................... 140 Summary Report on BAASS UAP Analysis Capabilities Page 8 November 23,2010 [PAGE 10] LIST OFTABLES pg. Table 1. Mach Regimes ................................................................................................................ 32 Table 4. Normalized radar Cross Section for a 10 m Metallic Sphere with a 1 m Table 5. Normalized radar Cross Section for a 10 m Metallic Sphere withal m Table 2. Velocities and Accelerations ofTic Tac for Parametric Time Durations ofEvent.. ...... 34 Table 3. Properties ofWater Used for ANSYS Hannonic Analyses ........................................... 60 Dielectric Coating in Decibels for 300 MHz and 25 Elements per Wavelength ............ 92 Dielectric Coating in Decibels for 300 MHz and 50 Elements per Wavelength ............ 94 Summary Report on BAASS UAP Analysis Capabilities Page 9 November 23, 2010 [PAGE 11] 1. EXECUTIVE SUMMARY The purpose of this r,eport is to summarize the field data collection, in-house databases and computational capabilities that currently reside at Bigelow Aerospace Advanced Space Studies (BAASS) for the study of advanced aerospace technology. Between 2008 and 20 IO BAASS was contracted by the Defense Warning Office of the Defense Intelligence Agency (DIA) to create, staff, and equip a new organization in order to examine and analyze the threat to national security associated with advanced aerospace technology. By selecting and modeling a few sentinel cases of encounters with advanced aerospace technology, this report demonstrates the in-house data collection, data storage and analysis resources built by BAASS under DIA contract HHM402-08-C-0072. Throughout the millennia individuals have observed and reported unexplained phenomena in the sky. Some ofthese reports included bright and flashing lights, objects streaking across the sky or silently hovering, and multiple colored and flashing structures morphing into one. Cylindrical, cigar, spherical, lenticular, triangular and ellipsoid shaped structures have been reported hovering and/or accelerating at rapid rates from a stationary position. Some of these abrupt, high speed maneuvers have been harder to explain with conventional physics, considering the inherently poor aerodynamic properties of many ofthese objects. It should be stressed many, but not all, of these sightings may be explained by natural phenomena, or by unacknowledged aerospace technology. Several official government studies were conducted from the late 1940s until around 1970, but many of these studies were superficial and lacking in rigor. Since 1970, because of an absence of research funding, the study of Unidentified Aerial Phenomena (UAP) has been characterized by cursory analysis and amateur, unscientific data collection. Pilots, both civilian and military, have reported seeing unusual objects in the air, some of which have been independently confirmed by radar. During the 1960s and 1970s a series of incidents was reported along the so called Northern Tier of the United States where silent hovering objects were observed over military facilities housing nuclear weapons. One report in March 1967 involving the simultaneous disabling of multiple missiles for a period of time, while a UAP allegedly hovered nearby, stimulated considerable public interest when information of the event began to emerge. The 1967 incident, if true, as well as other Northern Tier incidents, arguably had national security implications. Over the years, there have also been numerous reports of Unidentified Submerged Objects (USO), in all bodies of water. Some USO and UAP reportedly exhibited superior performance capabilities in velocity and acceleration underwater in the absence of detectable turbulence or cavitation signatures. While comparing our state of the art military equipment with these capabilities a reasonable individual may conclude there are national security implications. Bigelow Aerospace Advanced Space Studies, LLC (BAASS) is a research organization focused on the identification, evaluation, and acquisition of novel and emerging future technologies worldwide as they specifically relate to air and space craft. Cutting edge research areas include propulsion systems, space applications of nanosensors, piezoelectric and nanowire fabrics, human performance, plasma stealth technologies, and directed high energy weapons. BAASS Summary Report on BAASS UAP Analysis Capabilities Page 10 November 23, 2010 [PAGE 12] was contracted to the Defense Intelligence Agency (DIA) in 2008 to investigate and analyze the possibility of a credible threat posed by UAPs. To accomplish this mission, BAASS over the past two years has focused on developing three separate resources, each unique to the study of UAP: 1) to obtain the most comprehensive suite of portable field sensors and personnel available, 2) to build the most all-inclusive database of UAP performance capabilities and behavior in the world and 3) to acquire world class computational methodology for analysis of UAP data. This report touches on all aspects of these resources, but concentrates on the in-house computational capabilities. BAASS acquired the ANSYS Multiphysics Finite Element Analysis (FEA) program, for "a first of a kind" engineering and physics in-house resource devoted to providing a scientifically sound mathematical analysis and modeling of UAP behavior. Thus BAASS has acquired significant computational capability to convert field data into mathematical models and three dimensional simulations. This report provides theory, analytical and numerical solutions for selected UAP and USO incidents through engineering and physics analyses. In particular, we examine a sentinel incident - the "Tic Tac" event - where Fl A-18 aircraft from a United States Carrier Strike Group were vectored to a nearby unidentified contact in November 2004. The white object observed by four F/A-18F aircrew was described as 40 feet in length and shaped and colored like a "Tic Tac" candy. Many analyses of UAP may use analytical or closed form solutions to solve the equations that describe the physics of an event. Where analytical solutions do not exist or the geometry is too complex, ANSYS multiphysics provides a powerful computational platform to solve large problems numerically, while combining and solving many different physical equations. Compressible fluid flow analyses were performed to visualize the steady state pressure, temperature and Mach number contours around two craft shapes. An incompressible fluid flow problem around a solid disc shaped object descending through the air into a body of liquid was investigated to observe the disturbance produced on the surface of the water. A successful analysis of a USO was conducted using a full harmonic acoustics simulation; and computed values showed good agreement with the expected theoretical solutions. An analysis of a spherical UAP radar cross section (RCS) was conducted using a full harmonic electromagnetic simulation. Various other shapes of UAP and USOs may be evaluated by applying boundary conditions and transient physics equations to obtain a better understanding of the capabilities of these objects. BAASS employees and contractors comprise scientists, engineers, analysts, intelligence and investigative professionals with a wide range of technical capabilities and backgrounds. Many of the professional staff members are considered national and international experts in their respective fields. BAASS' personnel have experience in performing work for government agencies such as the Department of Energy and Department of Defense. A broad mandate to research and develop future technology platforms pertaining to advanced propulsion, advanced non- aerodynamic lift capabilities, future material science breakthroughs including nanofabrication, novel power generation and signature reduction technologies, human interaction and effects of advanced technologies including field and radiation biological effects exists in Summary Report on BAASS UAP Analysis Capabilities Page 11 November 23, 20 I 0 [PAGE 13] BAASS' work scope. BAASS' vision is to identify and acquire disruptive or discontinuous technologies that will fonn the basis of aerospace and defense applications through the year 2050, as well as those that pose potential threats to national security. The company goal is to become a major entity in the research and development of future aerospace propulsion systems, controls, detection and tracking systems, stealth and directed energy uses by employing the best and brightest engineers and scientists available. The previous mentioned capabilities place BAASS in a strong position to provide technical results in both classified and unclassified endeavors. Summary Report on BAASS UAP Analysis Capabilities Page 12 November 23, 2010 [PAGE 14] _ 2. INTRODUCTION 2.1 lliSTORICAL EVENTS AND STUDIES Disc, triangle, cigar and bell- shaped flying objects have been reported and documented on a global basis for millennia. The sighting by l1843(a)(2) Ion June 24, 1947 in the state of Washington garnered unprecedented global media attention and began the modern UFO era. While flying near Mt. Rainier, he observed a chain of nine unusual objects flying from north to 1843(a)(2) _sou.th.! !reported that "two or three of them would dip or change course slightly, just 1843(a)(2) ;~:~~;~~~~:~~;.~:~~~:v~r~::~~ l~~le 1 l~or:~~~~~~:~!~t~~t:d~~ ~I~~~-~ s~~i::~7,~~~ described them at the time their flight was like speed boats on rough water or similar to the tail of a Chinese kite that l once saw blowing in the wind. As l put it to newsmen in Pendleton, Oregon, they flew like a saucer would if you skipped it across the water." 1843(a)(2) Thus the moniker "flying saucer" was born. The terms "flying saucer" and " · used commonly and interchangeably in the media to describe what are now known as UFOs (Unidentified Flying Object). Many sightings of UFOs were reported by commercial and military pilots during the late 1940s and a flying saucer allegedly crashed outside of Roswell, New Mexico, in early July 1947. Shortly thereafter, a series of sightings of "green fireballs" began. These reports were almost exclusively over the state of New Mexico. Increasing significantly in number by December 1948, these sightings typically occurred over sensitive government installations, most notably the ~~~~:.,;i..l,lol.ll,l,...lol.lil£/.dia National Laboratories. An investigation was initiated by meteor expert After personally witnessing a green fireball four to five degrees above the - on- zo-n- on_ a__o_n__z.....ontal trajectory on December 12, 19481 !concluded the fireballs were 1~~~(~)(2) structured, that is, not atmospheric phenomena. InitiaHy they were thought to be of Russian origin. In April 1950, Project Twinkle was created to be a network of stations with the purpose of observing, studying, and collecting data on the fireball phenomena. This project did little to solve the mystery, and was disbanded later that year. Large numbers of UFO sightings continued in the late 1940s and as a result, some unease about the nature of the objects began to escalate in military circles, notably in the Air Force. For example, in September 1947, Air Force l1843(a)(2) lissued a memorandum stating 'The reported operating characteristics such as extreme rates ofclimb, maneuverability (particularly in roU), and motion which must be considered evasive when sighted or contacted by friendly aircraft and radar, lend belief to the y some of the objects are controlled either manually, automatically or remotely. 11 1843(a)(?L recommended a detailed study of the UFO phenomenon. Based on increasing concern o p rt ofthe military, the U.S. government initiated official studies ofUFOs. Project Sign was the first official U.S. government study of UFOs performed by the United States Air Force in early 1948 and concluded in early 1949. Project Sign officials argued UFOs were likely of extraterrestrial origin, and most of the project's personnel came to favor the extraterrestrial hypothesis. This hypothesis was rejected by the senior Air Force personnel. Project Sign eventually came to no oflicial conclusion about UFOs with the final report staling the existence of flying saucers could neither be confirmed nor denied. Project Sign was concluded and restarted as Project Grudge in February 1949. Summary Report on BAASS UAP Analysis Capabi lities Page 13 November 23, 2010 [PAGE 15] Project Grudge attempted to give each and every case a solution or an identifier tag. Grudge existed in various form and name until project completion in March 1952. The final Project Grudge report stated 22% of cases were categorized as unidentified, 69% identified, and 9% contained insufficient infonnation to categorize. In March 1952 Project Blue Book replaced Grudge and remained headquartered at the Air Technical Intelligence Center at Wright-Patterson Air Force Base in Ohio. Over the next seventeen years, Project Blue Book recorded approximately 15,000 UFO incidents, and Blue Book reported 701 of these incidents as "unidentifie " • • • • • in 1952 prompted the CIA to convene a scientific panel, 1843(a)(2) m January 1953 to examine recent UFO data. It is wt e y state among mo ·O organizations that the I1843(a)(2) Iadvocated a campaign to "debunk" UFOs. Beginning on November l, 1966, the Air Force Office of Scientific Research awarded $313 000 to a research team at the University of Colorado 1843(a)(2) >-----........ ..---...... .---..........--....-"'" study the scientific implications of UFOs. The stu y was un erta en on t e matena mis e y Project Blue Book. The 1843(a)(2) final (and controversial) conclusion stated "we have recommended agams e moun mg o a ma·or effort for continuing UFO study for scientific reasons." 1843(a)(2) announced Blue Book would be closed due to the fact further funding "cannot be justified either on the grounds of national security or in the interest of science." The last publicly taken report for project Blue Book operations was December 17, 1969, but officially it closed on January 30, 1970. Since the end of Blue Book numerous organizations have taken on the role of UFO/UAP investigations. Few ofthese groups have been professionally organized, trained, or equipped to properly investigate the phenomena. In contrast, one purpose of this report is to show BAASS is on the route to being the leading force in complete investigation and scientific analysis of the phenomena. 2.2 BAASS' TWELVE TECHNOLOGY FOCUS AREAS BAASS is a research organization focused on the identification, evaluation, and acquisition of novel and emerging future technologies worldwide as they specifically relate to air and space craft. Cutting edge research areas include propulsion systems, space applications of nanosensors, piezoelectric and nanowire fabrics, human perfonnance, plasma stealth technologies, and directed high energy technologies. Research and development necessary for the procurement of the technology required for advanced space and weapons systems is conducted through use of computational Multiphysics FEA programs, development of computer code, experimentation, material science testing and manufacturing of prototypes in BAASS/Bigelow Aerospace in-house and in collaborating facilities and laboratories. Research areas of interest include Computational Fluid Dynamics, Heat Transfer, Nuclear Engineering, Electromagnetics and Radio Frequencies, Theoretical and Computational Physics, Biological Sciences and Chemistry. Summary Report on BAASS UAP Analysis Capabilities Page 14 November 23, 2010 [PAGE 16] Research performed through theoretical and computational applications, as well as modeling of components of non-conventional propulsion systems is under way to provide for future development of vehicles capable of operating in the atmosphere, under water and in space. BAASS research intends to provide innovative approaches and concepts for aircraft, propulsion, and flight technologies demonstrating significant advances in performance and capabilities beyond those in operation today. BAASS' twelve key technology areas concentrate on how breakthrough technologies will provide for the development of advanced spacecraft concepts and weapon technologies through the year 2050 and beyond. The twelve areas are: l. Lift 2. Propulsion 3. Control 4. Power Generation 5. Spatial Temporal Translation 6. Materials 7. Configuration, Structure 8. Signature Reduction 9. Human Interface I0. Human Effects 11. Armament 12. Other Peripheral Areas 2.3 BAASS PERSONNEL, SOFTWARE, EQUIPMENT AND DATA WAREHOUSE Although the majority of this report is devoted to demonstrating BAASS' capabilities in mathematical modeling of various UAP performance parameters, the next section provides a short summary of some ofthe BAASS personnel, portable data collection sensors, as well as the current BAASS in-house database architecture. 2.3.1 BAASS Personnel BAASS employees and contractors comprise scientists, engineers, analysts, intelligence and investigative professionals from diverse backgrounds. A majority of BAASS personnel have performed work for government agencies such as the Department of Energy and Department of Defense. Research and development necessary for the procurement of the technology required for advanced space and weapons systems is conducted by numerical computational analysts through use of computational multiphysics FEA programs. Application and scientific programmers are involved in development of computer code that drives data mining and scientific applications used to evaluate historical and present UAP cases. Professionals in all areas conduct experimentation, material science testing and manufacturing of prototypes in both in-house facilities and collaborating facilities and laboratories. Areas of concentration include Summary Report on BAASS UAP Analysis Capabilities Page 15 November 23, 2010 [PAGE 17] Computational Fluid Dynamics (CFO), Heat Transfer, Nuclear Engineering, Electromagnetics and Radio Frequencies (RF), Theoretical and Computational Physics, Biological Sciences and Chemistry. 2.3.2 ANSYS Multiphysics FEA The ANSYS Workbench platform is a powerful multi-domain simulation environment that harnesses the core physics from ANSYS, enables their interoperability, and provides common tools for interfacing with CAD, repairing geometry, creating meshes and post-processing results. To our knowledge, this powerful computational capability has not been previously utilized in the 64 year history of UFO study. It is hypothesized that through this more broad ranging analysis, additional theoretical constructs can be generated regarding UAP and USO behavior. These in tum can provide the scaffolding for advanced engineering concepts. 2.3.3 Equipment 2.3.3.1 Field Investigative Equipment BAASS has amassed a considerable amount of field investigative equipment. The inventory includes a variety of iimaging devices, along with Global Positioning Systems (OPS) and range finding items. Of note are the following: 2.3.3.1.1 Canon 50 MK II Digital SLR Cameras Two Canon 5D MK 11, 21.1 Megapixel, Digital SLR cameras were selected based on their capability for low light photography when combined with the Canon EF 300 mm ultrasonic, and the Canon EF 24-105 mm ultrasonic lenses. The 21.1 Megapixel size allows for RAW images suitable for scientific examination and analysis. 2.3.3.1.2 Sony A350 Digital SLR camera The Sony A350 is a 14.2 Megapixel, digital SLR camera, with a Sony N 50-300 mm, a Sony N 50-70 mm lens, and a Sony Macro 2.8/50 mm lens. The a350 while a high quality camera, is compact and portable. It also allows for close-up and one-to-one photography. 2.3.3.1.3 Sony High Definition Video Cameras Three Sony High Definition Video (HOV) 1080i, High Definition Video cameras, with low light capability were chosen for video capture in various field conditions. 2.3.3.1.4 Sony Handicam, Digital Video Cameras Four Sony Handicam, digital video cameras with 80 GB hard drive storage capacity. These cameras are compact and portable, and using the HOD allow for up to 4 hours of continuous video recording with no tapes or other external media. They can also capture still images. Summary Report on BAASS UAP Analysis Capabilities Page 16 November 23, 2010 [PAGE 18] 2.3.3.1.5 ATT PVS-7, Night Vision Devices Seven A TT PVS-7, Nmght Vision Devices - military quality, state-of-the-art night vision devices. 2.3.3.1.6 Oasys Universal Thermal Monocular (UTM) This device is a ruggedizcd thermal imaging and designation system. It includes a digital magnetic, both still and video capture capability as well as a digital PC interface allowing for real-time review ofimages in the field. 2.3.3.1.7 Garmin Global Positioning Systems One Colorado 400t and two Oregon 400t, Global Positioning Systems, allowing for route mapping as well as waypoint storage in the field. 2.3.3.1.8 Leica Rangemaster 1200 Laser Range Finders These two range finders are accurate out to 1500 meters, extremely compact and user friendly. 2.3.3.1.9 Sony CyberShot Cameras Three Sony CyberShot I0.1 megapixel digital cameras - compact and portable for quick reaction to opportunities while actively investigating. These equipment items give BAASS considerable capability when investigating events in the field. In addition to the items listed above a wide range of other support type items are in the BAASS inventory. These include Toshiba laptop computers, digital voice recorders, digital Game Cameras, TR spot lights, power invertors, several pieces of older night vision equipment, and packaging and storage items for solid, liquids, and hazardous materials. In addition, BAASS obtained Technical Surveillance Countermeasures (TSCM) equipment in an effort to enhance the security of BAASS facilities. ln addition to the below listed TSCM equipment BAASS personnel are trained by Research Electronics International in Cookeville, TN; also the manufacturer of the equipment. • OSCOR 5000E, Omni-Spectral Correlator covering the radio frequency range from 50 kHz to 3 GHz • ORION Non-Linear Junction Detector • T ALAN Telephone Analyzer • CPM-700 Broadband Detector Summary Report on BAASS UAP Analysis Capabilities Page 17 November 23, 20 10 [PAGE 19] 2.3.3.2 Scientific Equipment 2.3.3.2.1 Veho VMS-001 200X 1.3 Megapixel Digital USB Microscope This instrument is a very portable (4.4 x 1.3 inches) digital microscope which expands the capability of the field! investigators. The microscope allows detailed images to be taken and connects directly to a laptop. Illumination is via 4 built in white LED lights. 2.3.3.2.2 Celestron 44340 3.5" LCD Digital Microscope This instrument is a bench top digital microscope. The microscope has magnification capabilities of 40-400,X extending up to 1600X with digital zoom. Images can be uploaded to a PC or laptop via a USB connection. It could also be taken into the field if required. 2.3.3.2.3 Niton XL3t 900S GOLDD Analyzer This instrument is an X-ray fluorescence (XRF) analyzer. The device analyzes the emission of characteristic "secondary" (or fluorescent) X-rays from a material that has been excited by bombarding with high-energy X-rays. BAASS field teams deploy the Niton and conduct on-site elemental analysis. 2.3.3.2.4 Colibri TTC Handhcld Dose Rate Meter This instrument package allows for the detection and quantification of alpha, beta and gamma radiation in the field. The ability to accurately measure and quantify these three types of radiation adds another critical level ofcapability to the BAASS arsenal ofanalysis. 2.3.3.2.5 Hand held Spectrum Analyzer Pro Bundle 3 (NF-5030 and HF-60100) These are instruments designed to detect and measure a broad spectrum of electromagnetic (EMF) radiation and high frequency radio waves. The NF-5030 measures three dimensional magnetic fields from as low as background up to 20 Gauss. Combining the two instruments electric fields are measured from 0.1 V/m to 20 kV/m and frequencies from 1 Ilz to 9.4 Gllz. Summary Report on BAASS UAP Analysis Capabilities Page 18 November 23, 2010 [PAGE 20] 2.3.3.6 Hardware for ANSYS Workbench Platform The research and work performed by BAASS ranges from technical design and prototyping, all the way up to advanced theoretical and computational studies of partial differential equations describing multiphysics problems. An expandable twelve core Hewlett Packard server with 48 GB of RAM and I TB of storage is used to perform parallel processing solutions for structural, fluid flow, heat transfer, high and low frequency electromagnetic problems along with coupled physics oftwo or more of those listed previously. 2.3.4 Data Warehouse BAASS developed a Data Warehouse to support research on UAP and related anomalies and titled it "Project CAPELLA". The BAASS Data Warehouse is revolutionary because it: 1) AAP Person incorporates a format ~a~_c!_on _the~ - JSix Layer Model for analyzing UAP, 2) ~· MP 58 •·· includes several new databases developed by BAA S, and 3) incl.udes databases developed by erson others which have never been collectively analyzed. The Data Warehouse currently consists of eleven separate databases and their associated supporting documentation in electronic format such as witness interviews, photographs, videos, recordings, sketches, analytical reports, etc. Each of the databases contains UAP sighting events relating lo the purpose of that particular database, although some of the reported cases do overlap. Four of the databases will continue to catalogue current and future sighting reports. Seven of the databases have been completed and fully integrated and populated with all pertinent information captured by the CAPELLA format. BAASS will continue to input historical data in the CAPELLA format and will expand the Data Warehouse with additional databases and unusual aerial phenomena information. The eleven databases currently included in the Data Warehouse are: I . NIOS Database 2. l 1843(a)(2) !Pilot Database 3. Sign/Grudge/Dlue Book Database 4. UFOCA T Database 5. MUFON Case Management System Database 6. Project Colares Database 7. Canadian Release Database 8. United Kingdom Release Database 9. BAASS Database 10. Utah Ranch Database 11. Post-Utah Ranch EITects Database Summary Report on BAASS UAP Analysis Capabilities Page 19 November 23, 20 I 0 [PAGE 21] The BAASS Data Warehouse is an electronic repository for historical, ongoing, and future UAP reporting and investigations. The Data Warehouse is designed to facilitate sophisticated analyses and data mining to improve our understanding ofthe extent, structure, and frequency of UAP, as well as their potential correlation to known physical, environmental, biological, or socio-political factors. 2.3.4.1 CAPELLA Format AAP Person 5, AAP The CAPELLA database format is based upon the "Six Layer Model for Ano alous Person 58 0 Phenomena" developed by !AAP Person 5 Iand .,..fA ....,...P_P_e_rs_...,n,...s..,.a ..... 1i.....-................................. ·~ _ ... --·_---_.. ....................1 1 This six layer model encapsulates all of the potential characteristics o UAP events that can e studied. The six layers are: 1. The Physical Layer - those physical characteristics associated with a UAP event 2. The Anti-Physical Layer - the patterns that conflict with those predicted in modem physics 3. The Psychological Layer - the psychological impacts to the witness(es) and the social conditions that surround them 4. The Physiological Layer - the effects perceived by humans 5. The Psychic Layer - the effects commonly found in parapsychology literature 6. The Cultural Layer - the primary and secondary effects upon society. Additionally, the CAPELLA format captures administrative details associated with the UAP event, such as witness information, location, date, time, duration, etc. 2.3.4.2 Data Warehouse Upgrade BAASS is undergoing a database upgrade project to further enhance data security and integrity, and increase processing power for greater analytical capability. The CAPELLA framework and methodologies will be preserved in the upgraded system. This upgrade will increase efficiency and effectiveness, and will allow databases to be analyzed individually or collectively. 2.3.4.3 Statistical Analysis BAASS h u~OJ21$.1S::a....LimL:.1S:~ l, yet comprehensive statistical analyses for three of the databases: !i:-"TT':=c:-T~=~--,r,:1 Pilot Database, Pro·ect Si n/Grudge/Blue Book Database, and the U anc a ase. e analyses on th 1843(a)(2) and Blue Book databases are focused on identifying patterns of technical information om e case reports. The Utah Ranch analysis delves into patterns and aspects of when anomalous activity is reported in an attempt to identify potential times and improve the means of future detection methods. Summary Report on BA.ASS UAP Analysis Capabilities Page 20 November 23,2010 [PAGE 22] 3. TYPES OF UAPS OBSERVED NASA aeronautical engineed 1843(a)(2) Imade important inroads into attempts to delineate some quantitative characteristics ofUFO perfonnance by close examination of, and derivation of numerical parame • . ligated sentinel UFO casesP843(a)(2) I ln addition, computer scientist AAP Person 5 has attem ted to compute estimates of optical power output derived from reports AAP Person 5 This report attempts to extend and broaden these preliminary studies using considerably enhanced computational power and mathematical modeling capabilities. Figure 1, taken froml1843(a)(2) !depicts illustrations of the various shapes associated with the UAP phenomena. [Diagram: chart titled "THE UFO PATTERN: A Condensed Statement of Repeated Observations," listing labeled line-drawing silhouettes of UAP shape categories under "CONFIGURATIONS OF HIGHLY REPEATING SHAPES": Saucer (Domed Saucer [most common], Lenticular Saucer or Disk, Lenticular Saucer with Dome), Flat-Topped Straw Hat, Double Hat, Conical Hat (giant), Sphere, Saturn, Ellipsoidal (egg or football) (Hovering, Underway), Cylindrical (giant cigar), Dirigible (large) (Luminous Plume), Triangle or Boomerang (Delta, Equilateral). Footnote: "NOTE: (1) Shine marks show typical night time air glow. (2) Dash-dot vertical centerline is saucer axis of symmetry. (3) Giant cigars have plumes also."] As an important component of these studies, BAASS understands a considerable number, possibly a majority, of UAP reports can be explained by simple misidentification of current advanced technology platforms. Some recent black triangle and even possibly some saucer and hat shaped UAP reports over the last several decades may have been explained by aircraft sightings of the Lockheed SR-71 Blackbird (Figure 2), Lockheed F-117 Nighthawk Stealth Fighter (Figure 3), Northrop Grumman B-2 Spirit Stealth Bomber (Figure 4) and Boeing Phantom Works Stealth X-45A Unmanned Arial Vehicles (UAV) (Figure 5). Nevertheless, a significant number of cylindrical and cigar shapes along with spherical, lenticular and ellipsoid Summary Report on BAASS UAP Analysis Capabilities Page 21 November 23, 2010 [PAGE 23] shaped UAPs which appear to hover and/or accelerate at rapid rates from a stationary position have been harder to explain considering the inherently poor aerodynamic properties of these objects. It is this latter subset of UAP reports that BAASS has focused on. Figure 2. Lockheed Martin Skunk Works SR-71 Black Bird Figure 3. Lockheed F-117 Nighthawk Stealth Fighter Summary Report on BAASS UAP Analysis Capabilities Page 22 November 23. 2010 [PAGE 24] Figure 4. Northrop Grumman B-2 Spirit Stealth Bomber Figure 5. Boeing Phantom Works B-2 Stealth X-45A UAV Summary Report on B/\ASS IJAP Analysis Capubilitic:s Pugc 21 November 23. 2010 [PAGE 25] Figure 6. Three Dimensional Rendering of a Cylindrical or "Tic Tac" UAP Figure 7. Three Dimensional Rendering of a Metallic Spherical UAP Summary Report on BA ASS UAP Analysi'> <'arabilities Page 24 November 23, 20I 0 [PAGE 26] 4. ANALYTICAL AND NUMERICAL SOLUTIONS FOR UAP INVESTIGATIONS 4.1 "TIC TAC" INCIDENT The following summary is excerpted from the report of an investigation conducted by personnel assigned to DIA of an observation by elements of the Nimitz Carrier Strike Group of UAP off the coast of Mexico in November 2004. Note: The DIA personnel who wrote the report utilized the term Anomalous Aerial Vehicle (AAV) rather than the more common Unidentified Aerial Phenomenon (UAP) or Unidentified Flying Object (UFO). All three terms, AAV, UAP, and UFO are used at different times in this section and should be considered interchangeable. During the period of approximately I 0-16 November 2004, the Nimitz Carrier Strike Group (CSG) was operating off the western coast of the United States in preparation for their deployment to the Arabian Sea. The USS Princeton on several occasions detected multiple Anomalous Aerial Vehicles (AAVs) operating in and around the vicinity of the CSG. The AAVs would descend "very rapidly" from approximately 60,000 feet down to approximately 50 feet in a matter of seconds. They would then hover or stay stationary on the radar for a short time and depart at high velocities and tum rates. On 14 November after again detecting the AAV, the USS Princeton took the opportunity of having a flight oftwo FlA-18Fs returning from a training mission to further investigate the AAV. The USS Princeton took over control of the F/A-l 8s from the E-2C Airborne Early Warning aircraft and vectored in the f/A- l 8s for intercept leading to visual contact approximately one mile away from the AAV, which was reported to be "an elongated egg or a 'Tic Tac' shape with a discernable midline horizontal axis." It was "solid white, smooth, with no edges. It was "uniformly colored with no nacelles, pylons, or wings." It was approximately 46 feet in length. The F/A-18Fs radar could not obtain a 'lock' on the AAV; however it could be tracked while stationary and at slower speeds with the Forward Looking Infrared (FLIR). The AAV did take evasive actions upon intercept by the F/A-18 demonstrating an advanced acceleration (g), aerodynamic, and propulsion capability. The AAV did not take any offensive action against the CSG; however, given its ability to operate unchallenged in close vicinity to the CSG it demonstrated the potential to conduct undetected reconnaissance leaving the CSG with a limited ability to detect, track, and/or engage the/\/\V. According to l1843(a)(2) Ithe AAVs would descend from a very high altitude into the scan volume of the AN/SPY-1 at a high velocity. The top of the scan volume would put the AAVs at higher than 60,000 feet. The AAVs would descend "very rapidly" from approximately 60,000 feet down to approximately 50 feet in a matter of seconds. They would then hover for a short time and depart at high velocities and at tum rates demonstrating an advanced acceleration (g) capability. p843(a)(2) 7 added that based on his experience, which is 17 years as a Fire Control on Aegis cruisers, Che AA V exhibited ballistic missile Characteristics in reference to its appearance, velocity, and indications on the radar. Since the radar was in the mode to handle /\ir Intercept of conventional aircraft it never obtained an accurate track of the AAVs and was quickly "dropped" by the radar meaning it was eliminated by the computer to reduce the amount ofclutter on the radar, as any other false target is handled. If the radar were set up in a mode for Ballistic Missile tracking they likely would have had the capability to track the AAV. They were detected three separate times during the week operating off the western coast of the United States and Mexico. The Tactical Air Officer onboard the Princeton could not identify the radar contact Summary Report on B/\ASS UAP Analysis Capabilities Page 25 November 23, 2010 [PAGE 27] and given the high speed and altitude was perplexed. On 14 November 2004, after again detecting an AA V took the opportunity of two F/A-18s airborne in the vicinity to task them for airborne reconnaissance ofthe AA V. Figure 8. Location of the AAV during the F/A18 Intercept !AAP Person 9 bwas flying a single seat F/A-18C that launched from the USS Nimitz at approximately 1030L to conduct a Functional Check Flight of an aircraft that had recently completed significant maintenance. He noted the weather that day was blue skies. no clouds, and unlimited visibility. After 30 minutes into his flight he received a radio call from his air controller asking him to investigate an unidentified airborne contact. This was not a standard request. Additionally the controller asked if he had ordnance onboard, which was odd since no controller had ever asked that question during a SummaJ)' Report on BA.A~S LAP Analysis Capabilities Page 26 November 23. 2010 [PAGE 28] situation of identifying an unknown contact over U.S. or International territory. He responded that he had no ordnance onboard. The controller provided vectors to the vicinity of Figure 8. The object was reported to be at "slow speed and low altitude." While en route at approximately 250 knots indicated/400 knots groundspeed at mediwn altitude (15-25,000 feet), he gained radar contact of what he believed to be two F/A-18Fs that were approaching the AA V from the west at low altitude (500- 5,000 feet). There was no other traffic on the radar. The controller informed him to remain above I 0,000 feet, as there was other fighter traffic at low altitude investigating the AAV. As he approached approximately 15nm from the AA V descending through approximately 15,000 feet, he could see a water disturbance in the ocean surface. He recalled that the sea state was low (calm). At approximately 5-10 nm away from the AAV, the controller told him to "skip it'' and return to his operating area. Since he was close he elected to fly over the water disturbance to try and see what was causing it. The disturbance appeared to be 50 to I 00 meters in diameter and close to round. It was the only area and type ofwhitewater activity that could be seen and reminded him ofimages of something rapidly submerging from the surface like a submarine or ship sinking. It also looked like a possible area of shoal water where the swell was breaking over a barely submerged reef or island. He overflew the disturbance and turned back to the northwest. As he was flying away he could see the disturbance clearing and could no longer identify the place where it occurred. He did not see any object or vessel associated with the disturbance either above the surface, on the surface, or below the surface. He also never made visual contact with the other fighter aircraft that were vectored to the location or the AA V. It is possible that the disturbance was being caused by an AA V but that the AA V was 'cloaked' or invisible to the human eye. !MP Person 9 !recovered aboard the Nimitz at approximately 1200L. H~~........,.......,....,..........,'"'14' Intelligence Center (CVIC) and was asked by hi • Officer saw the "supersonic Tic Tac"? We questioned now-:,-----;-,---r- o dete ~:--:T~-c-::-::i-=::-:-:,~.... information but based on his position in CVIC a was not involved in any further discussions concerning the AAV. 1843(a)(2) He and 1843(a)(2) ere in the lead aircraft of the first F/A-18F section airborne a ay om - , 1843(a)(2) The flight walked, started and launched with no issue. They completed their departure from the USS Nimitz and flew to the working area to conduct the training portion of the flight. After they completed their training the E-2C controller handed them off to the USS Princeton!1843(a)(2) f1here they received vectors via Bearing Range Altitude Aspect (BRAA) to an unknown contact flyin into the w~king ar a from the 1843(a)(2) . south. -1··--· !asked what ordnance they had on board. 1843(a)(2) tol -··-- controLthaL1~A3(a)(2) they had two captive training AJM-9Ms {CATM-9) and no o er or nance. The flight descended to between 20-24,000 feet and proceeded to the contact. !1B43(a)(2) Idid not recall any indications via on-board sensor of the object. Their aircraft was not carrying a Forward Looking Infrared (FLIR) pod onboard. As l1843(a)(2) Iremembers it, the radar Attack Display was clean (no targets). Summary Report on BAJ\SS UAP Analysis Capabilities Page 27 November 23, 201 0 [PAGE 29] • 1843 2 1843 2 L ___(a_)_( _)_,...-=-=.=i.....,..__(a_)(__l _ .....were attem ting acquire the object visually as they heard "merge 1843(a)(2) plo.e .from- - - -- According to 1843(a)(2) the first indication he had of the unknown contact was a visua o a isturbance on the water below the AAV. As he scanned the area he gained a visual on the object. It is important to note that when asked to describe the disturbance on the water he stated that it was localized underneath the object, did not appear as a trail or wake, and looked like frothy waves and foam almost as ifthe water was boiling. At this oint 1843(a)(Z) detached !1843(a)(2) !which held at approximately 20,000 feet, escended to between 12-16,000 feet. 1843(a)(2) attempted a "helmet at was unsuccessful. It is important to note that 1843(a)(2) as using the Joint Helmet Mounted Cuing System which will cue the aircraft sensors sue as e radar to 'lock on' to what the pilot is looking at and it also has a recording capability. It may have been useful in this situation but typically because of the large amount of head movement it is not practical. c::]J §4.~(~)(2) 1843(a)(2L i:=-lstated that the helmet' s recording capability was rarely used therefore he did not think to ~ atday. 1843(a)(2) communicated what they were seeing with ! =3eontrol-ana-said-thathe .hada 1843(a)(2) runnmg ia ogue on the interflight radio withj1 843(a)(2) !stated that the object was "holding like a Harrier." (Referring to the AV-8B jet aircraft, which is capable of hovering and Vertical/Short Takeoff and Landing (V/STOL) via thrust vectoring.) According to r-::1.~43(a)(2) 1843(a~_(?Ll !the object's shape was like an elongated egg or a 'Tic Tac' and had a discemable m~ • horizontal axis. However, the object was uniformly white across the entire body. It was approximately 46 feet in length. 1843(a)(2) escribed it as "solid white, smooth, with no edges. It was uniformly colored wi no nace es, pylons, or wings." When asked to describe the appearance, if it glowed or reflected sunlight he said, "neither, it looked like it had a white candy-coated shell, almost like a white board." His report differs from !1843(a)(2) Iin that he reported the object traveling level at approximately 500-1000 feet at approximately 500 knots. The object was pointed in a north/south orientation and was moving both north & south and east & west, while maintainin a consistent altitude. These displacements, according to !1843(a)(2) were minor. 1843(a)(2) stated he then began a descent with the intention to take a close aboard pass with the object in an attempt lo visually identify it. They began the decent as the rolled in from about 10,000 ft and approximately 350 knots to take the object close aboard. 1843(a)(2) pulled nose on and then pulled trail (aft) of the object. As they were maneuvering, the object 1843( )(2) appeared, according toj1843(a)(2) l"to recognize us." He assessed this from the fact th4ohject ( ~ "pointed" (realigned its axis) in the direction of their aircraft. At this time, according t •.,' 1843(a)(2) .[:=] the disturbance on the water ceased. As they completed this maneuver, the ob·eel ascended quickly and pulled lift vector on and aft of them at a supersonic speed. 1843(a)(2) commanded the radar through the Short Range radar set and asked for a picture from 1843(a)(2) initially reported that the "picture was clean" (no contact) but then stated "you' re not gomg to elieve this, it's at your CAP" meaning that the AAV had flown to their training CAP, which was located in the southern end of the training area and had climbed to approximately 24,000 feet. 1843(a)(2) stated that the flight attempted to locate both the object and the disturbance with no success. 1843(a)(2) stated that nothing was seen on the surface or subsurface and that there were no indications ofthe previous disturbance. Summary Report on BAASS UAP Analysis Capabilities Page 28 November 23, 2010 [PAGE 30] •• Following the engagement, the flight rejoined and returned to the USS Nimjtz_ When asked how the jets functioned and if there was any indications of a system malfunction, he stated that, "the jets were brand new, less than 1 hr n h m. They were working perfectly." 1843(a)(2) when asked, said that all aircraft systems were functional. That there were no ID1Ss1on computer issues or avionics issues and that there was no radio or communication interference and that they had entry into the Link-16 network. When asked, 1843(a)(2) couldn't confirm any physiological or psychological feelings that were out ofthe or mary. 1843 2 1843(a)(2) was a member ofVFA-41 and was the l.____<a_H__) _______, 1843(a}J?L .... . flying wi 1843(a)(2) They were a part of the second F/A- l 8F section airborne at ay from VFA-41. Their flight launched following the !1 843(a)(2) !flight. The crews spoke with each other in the paraloft, discussed the object and that the flights were scheduled for the same working area. !1843(a)(2) !flight toldl1843(a)(2) Iflight what they saw and to try to see and record what they could. There were no clouds and there was a discernable horizon. The time was approximately 1500L. All on board systems were functiorung normally. The radar was in a standard search mode (RWS/ 80NM/ 4bar/ intr) and the FLIR was in L+S slave (the FLIR would point in direction of an L+S track). There was no radio or commurucation interference and they had entry into the Link-16 network. Initial awareness of an object came via the radar. Accordjng to the radar 1843(a)(2) dis la , the injtial tracks were at approximately 30-40 nm to the south of the aircraft. r7 1843(a)(2) was controlling the radar and FLIR and attempted multiple times to transition tFie ra ar to mgle Target Track (SIT) mode on the object. The radar could not take a lock, the b-sweep would raster around the hit, build an initial aspect vector (which never stabilized) and then would drop and continue normal RWS b-sweep. When asked, !1843(a)(2) !stated that there were no jamming cues (strobe, champagne bubbles, "any normal EA indications"). It "just appeared as if the radar couldn't hack it." The radar couldn't receive enough information to create a single target track file. The FLIR, in L+S slave, pointed in the direction of the initial track flies as the radar attempted lock. The FUR showed an object at 0 ATA and approximately -5 deg elevation (Figure 9). According tq 1843(a)(2) t'the target was best guess co-altitude or a few thousand feet below," estimating the object to be between 15-20 thousand feet. The object, according to the FLIR, appeared stationary (Figure l 0). There was no discemable movement from the object with the only closure being a result of the aircraft' s movement. As 1843(a)(2) watched the object it began to move out of FLIR field of view to the left. O tS4~(a)(2) 1843(a)(2) made no attempt to slew the FLIR and subsequently lost situational awareness to the ••• • object. The Flight continued with training mission with no further contact with object. Summa1y Report on BAASS UAP Analysis Capabilities Page 29 November 23, 2010 [PAGE 31] Figure 9. FUR in 'White Hot' Mode Figure 10. FUR in "Black Hot" mode Summary Report on 13/\J\SS l JJ\P /\nalysi" Capnhilitics Pngc 10 November 23. 20 10 [PAGE 32] ---------------- 1843(a)(2) was clear in that he couldn't confirm that it was the same object as described by 1843 a 2 flight. He never had visual, only seeing the object via the FLIR. He reaffirmed that all systems were functional. Following completion of the training portion, the section returned to the shi. for a normal approach, landing and shutdown. The crew met in CVlC and debriefed. 1843(a)(2) said that the CJVC section attempted to collect his tapes but he refused. They proceeded to their ready room where they debriefed withl1843(a)(2) land his fl~ • the tapes were made with a set being turned into the intelligence section. l...=jJ~.4~.(~)(2) 1843(a)(2) was not asked to sign any non-disclosure agreement and he is uncertain how far up the chain the reporting went past his commanding officer. When askedJ1843(a)(2) I couldn't confirm any physiological or psychological. feelings that were out of the ordinary. He only expressed a feeling ofconfusion during the event. According to former!1843(a){2) Inow a civilian working rorl1843(a)(2) Iwho was a !1843(a)(2) I onboard the Louisville in November 2004 during the AAV activity there were no unidentified sonar contacts in the vicinit of the aerial si htin ,s or an time durin , the o erations off the coast of California. The forme 1843(a)(2) 1843 (a) ( 2) confirmed that there was no anomalous undersea activity during this period. There was a 1ve ire exercise conducted by the USS Louisville during the period of and in the vicinity of the AAV sightings; however, the weapon in use did not match the flight profile or visible characteristics of the AAV. Additionally any live fire would have been coordinated throughout the CSG and all air traffic would have been well aware of the launch and operati.on of the weapon system. Aircraft would not have been vectored for the intercept of a US Weapon in Oight. Based on the lack of detection of any unidentified sonar contacts it is highly unlikely that an AAV operated below the surface of the ocean; it is possible that the AAV demonstrated the ability to be cloaked or invisible to the human eye based on ilot re orting of the water disturbance with no visible craft. Based on the assessment of 1843(a)(2) if the AAV did operate underwater undetected it would represent a highly a vance capability given the advanced capability of our sensors. Key Assessments According to DIA Report • The Anomalous Aerial Vehicle (AAV) was no known aircraft or air vehicle currently in the inventory of the United States or any foreign nation. • The AAV exhibited advanced low observable characteristics al multiple radar bands rendering US radar based engagement capabilities ineffective. • The M V exhibited advanced aerodynamic performance with no visible control surfaces and no visible means to generate lift. • The AAV exhibited advanced propulsion capability by demonstrating the ability to remain stationary with little to no variation in altitude transitioning to horizontal and/or vertical velocities far greater than any known aerial vehicle with Uttle to no visible signature. • The AAV possibly demonstrated the ability to 'cloak' or become invisible to the human eye or human observation. Summary Report on BAASS UAP Analysis Capabilities Page 31 November 23,2010 [PAGE 33] The AA V possibly demonstrated a highly advanced capability to operate undersea completely undetectable by our most advanced sensors. The so called "Tic Tac" incident has many physics and engineering aspects that may be studied with regards to understanding the performance capabilities and propulsion mechanisms of the craft. Since there was lit1le hard data, most analyses of the incident had to be made using either parametric studies or assumptions based on eye witness testimony. 4.1.1 Analytical Solutions of Velocities and Accelerations Associated with "Tic Tac" Performance An initial starting point consisted ofusing basic physics formulas for the calculation ofvelocities and accelerations based on the distance s the object traveled and the duration time I of the incident. Since no exact duration was known, as the radar operator noted that it occurred in a matter of "seconds," a parametric range from 0.5 seconds to 10 seconds was studied (assuming instantaneous velocities and accelerations). ds v= dt dv a= dt Flight is classified in six categories as shown in the table below. Table 1. Mach Regimes Regime Subsonic Transonic Sonic Supersonic Hypersonic High- hypersonic Re-entry Speeds Mach Number < 1.0 0.8 1.2 1.0 1.0 - 5.0 5.0 - 10.0 10.0 25.0 > 25.0 Due to the lack of data, only the instantaneous velocity of the craft v and the instantaneous acceleration a, were computable. For the velocity and deceleration witnessed, a negative sign is implied to represent the direction component ofthe vector. Assumptions: 1. Elevation of 60,000 ft to Sea Level - It was reported by radar observation the object descended from approximately 60,000 ft to sea level in a matter ofseconds. 2. Matter of Seconds - A range of 0.5 seconds to 10 seconds was used for a parametric study. 4.1.2 Summary of Analytical Velocity and Acceleration Solutions Table 2 provides the computed values of instantaneous velocities and decelerations in ft/s and mph and ft/sec2 and g respectively for each chosen .6t. Figure 11 through Figure 14 show Summary Report on BAASS UAP Analysis Capabilities Page 32 November 23, 2010 [PAGE 34] non-continuous plots for velocity and acceleration in each unit for a specific 6t event duration. As one may observe from the table and graphs, extremely small and small duration times specifically between 0.5 and 5 seconds provide high velocities and accelerations. Most of the values in the table represent extraordinary velocities and all fall between lhypersonic and re-entry speed Mach regimes. Acceleration values also show a very high number ofg. An examination of Table 2 at a 6t of5.0 sec reveals the average velocity of the craft was 12,000 ft/sec (8,182 mph or Mach 10. 7). A very high deceleration value is also witnessed at 2400 ft/sec2 or 75 g. These are extraordinarily high values and would require some form of acceleration manipulation to limit what a human pilot would experience and be able to survive. Summary Report on BAASS UAP Analysis Capabilities Page 33 November 23, 2010 [PAGE 35] Table 2. Velocities and Accelerations of Tic Tac for Parametric Time Durations of Event !1s 60000 feet !1s 11.36364 miles l'1t (sec) V (ft/s) v (mph) Mach Number J a (ft/s2) a (g) 0.0 0 0 0.0 32.2 2 12 0.5 120,000 81,818 107.5 240,000 7,453 1.0 60,000 40,909 53.7 60,000 1,863 1.5 40,000 27,273 35.8 26,667 828 2.0 30,000 20,455 26.9 15,000 466 2.5 24,000 16,364 21.5 9,600 298 3.0 20,000 13,636 17.9 6,667 207 3.5 17,143 11,688 15.4 4,898 152 4.0 15,000 10,227 13.4 3,750 116 4.5 13,333 9,091 11.9 2,963 92 5.0 12,000 8,182 10.7 2,400 75 5.5 10,909 7,438 9.8 1,983 62 6.0 10,000 6,818 9.0 1,667 52 6.5 9,231 6,294 8.3 1,420 44 7.0 8,571 5,844 7.7 1,224 38 7.5 8,000 5,455 7.2 1,067 33 8.0 7,500 5,114 6.7 938 29 8.5 7,059 4,813 6.3 830 26 9.0 6,667 4,545 6.0 741 23 9.5 6,316 4,306 5.7 665 21 10.0 6,000 4,091 5.4 600 19 1 Computed using the speed ofsound at sea level under standard conditions 2 Standard acceleration due to g avity Summary Report on BAASS UAP Analysis Capabilities Page 34 November 23, 2010 [PAGE 36] [Diagram: scatter chart titled "Tic Tac Parametric Velocities for Selected Times of Event Duration (Points are Not Continuous)" plotting velocity in ft/sec on the y-axis against Time (seconds, 0.0-10.0) on the x-axis.] Figure 11. Tic Tac Parametric Velocities for Selected nmes of Event Duration in ft/sec Summary Report on BAASS UAP Analysis Capabilities Page 35 November 23. 2010 [PAGE 37] [Diagram: scatter chart titled "Tic Tac Parametric Velocities for Selected Times of Event Duration (Points are Not Continuous)" plotting velocity in mph on the y-axis against Time (seconds, 0.0-10.0) on the x-axis.] Figure 12. Tic Tac Parametric Velocities for Selected Times of Event Duration in mph Summary Report on BAASS UAP Analysis Capabilities Page 36 November 23, 201 0 [PAGE 38] [Diagram: scatter chart titled "Tic Tac Parametric Accelerations for Selected Times of Event Duration (Points are Not Continuous)" plotting acceleration in ft/sec2 (log scale) on the y-axis against Time (seconds, 0.0-10.0) on the x-axis.] Figure 13. Tic Tac Parametric Accelerations for Selected Times of Event Duration in ft/sec 2 Summary Report on BAASS UAP Analysis Capabilities Page 37 November 23. 2010 [PAGE 39] [Diagram: scatter chart titled "Tic Tac Parametric Accelerations for Selected Times of Event Duration (Points are Not Continuous)" plotting acceleration in g (log scale) on the y-axis against Time (seconds, 0.0-10.0) on the x-axis.] Figure 14. Tic Tac Parametric Accelerations for Selected Times of Event Duration in g Summary Report on BAASS UAP Analysis Capabilities Page 38 November 23. 2010 [PAGE 40] 4.1.3 Numerical Analysis ofCompressible Flow Compressible fluid flow analyses were performed to visualize the steady state pressure, temperature and Mach number contours around two craft shapes ("Tic Tac" and right circular cylinder). The use of compressible fluid flow and modeling of air as an ideal gas assumed the aerodynamics over the craft were not being controlled or modified through other means. Steady state solutions for pressure, temperature and Mach number contours around both a "Tic Tac" shape and .a right circular cylinder were obtained under subsonic, supersonic and mixed conditions. The CFX module was capable of solving the three dimensional unsteady Navier- Stokes equations in their conservation form as shown below in Cartesian coordinates in the x, y and z directions numerically. For the steady state solutions, the transient terms were unchanging and fall out ofthe equations below. Momentum: f)w 8w 8w 8w) fJp ( fflw fflw fflw) p ( 8t, + u {)x + v f)y + w f}z f}z + µ lJx2 + l)y2 + 8z2 + P9: . Continuity: Energy: where: A - Area (m2) g - gravitational acceleration (9.8 m/s2) gx - x directional component ofgravitational acceleration gy - y directional component ofgravitational acceleration gz - z directional component of gravitational acceleration e - specific internal energy (J/kg) p - density of the fluid (kg/m3) µ - dynamic viscosity of the fluid (Pa ·s) p - pressure (Pa) t - time (sec) Summary Report on BAASS UAP Analysis Capabilities Page 39 November 23, 2010 [PAGE 41] u - x velocity (m/s) v - y velocity (mis) w - z velocity (mis) x - x coordinate y - y coordinate z - z coordinate The following sections provide steady state pressure, temperature and Mach number contours over the "Tic Tac" and right circular cylinder for velocities of 700 mph and 1500 mph with an environmental air temperature of 223 K (-58°F). Attachment II and Attachment ill show contours for subsonic speeds below 700 mph and supersonic increments between 700 mph and 1500 mph for the "Tic Tac" and a right circular cylinder respectively. A comparison of the profiles of the "Tic Tac" geometry and that of a right circular cylinder was performed due to other numerous reports of craft with similar capabilities but lacking curvature at the ends ofthe craft. A flat 90° surface moving through the air would be expected to cause greater resistance during flight. Assumptions: 1. Elevation of 30,000 ft - It was reported by radar observation the object descended from approximately 60,000 ft to sea level in a matter ofseconds. An average 6s is computed by: S2 - S1 60,000ft - Oft 6s = = =30,000ft 2 2 2. Ambient Air Temperature of 223 K (-58F) - An approximate ambient environmental temperature of 223 K was chosen in accordance with an average elevation in the range of 30,000 ft (which varies with weather conditions) as a starting point for computational investigations. 3. Air Modeled as an Ideal Gas - Air Temperature, pressure and density are all interdependent and are given by the relationship ofthe ideal gas law: pRuT p = - M where: 1 Ru- Gas Constant (8.3 14472 m3-Pa ·K-1-mor ) M - Molar Mass (g/mol) T - Temperature (K) Since the temperature and density of air decreases with altitude, so does the speed of sound, hence a given true velocity results in a higher Mach number at higher altitudes. The slice used for the contours was taken axially for each geometric configuration. Reports from aircrew on sight indicate the object flew in a horizontal position. A 0° angle of attack was used in all cases to try to replicate observed flight conditions. Summary Report on BAASS UAP Analysis Capabilities Page 40 November 23, 2010 [PAGE 42] [Diagram: CFD color contour plot of simulated pressure (Pa) around the "Tic Tac" capsule-shaped craft model, with a numeric color-scale legend (values not reliably legible from the scan).] Figure 15. Tic Tac Pressure at 1/6 Scale, Air Temperature 223K and 700 mph with Mixed Inlet and Supersonic Outlet [Diagram: CFD color contour plot of simulated temperature (K) around the "Tic Tac" capsule-shaped craft model, with a numeric color-scale legend (values not reliably legible from the scan).] Figure 16. Tic Tac Temperature at 1/6 Scale, Air Temperature 223K and 700 mph with Mixed Inlet and Supersonic Outlet Summm) Report 011 BJ\ASS l lJ\P J\nah sis Capabilities Page 41 November 23. 20 10 [PAGE 43] [Diagram: CFD color contour plot of simulated Mach number (dimensionless) around the "Tic Tac" capsule-shaped craft model, with a numeric color-scale legend (values not reliably legible from the scan).] Figure 17. Tic Tac Mach Number at 1/6 Scale, Air Temperature 223K and 700 mph with Mixed Inlet and Supersonic Outlet [Diagram: CFD color contour plot of simulated pressure (Pa) around the "Tic Tac" capsule-shaped craft model, with a numeric color-scale legend (values not reliably legible from the scan).] Figure 18. Tic Tac Pressure at 1/6 Scale, Air Temperature 223K and 1500 mph with Supersonic Inlet and Supersonic Outlet Sumrna 1 Report on B/\/\SS l!/\P Anal) si-; C'apahilitics Page 42 November 23, 20 10 [PAGE 44] [Diagram: CFD color contour plot of simulated temperature (K) around the "Tic Tac" capsule-shaped craft model, with a numeric color-scale legend (values not reliably legible from the scan).] Figure 19. Tic Tac Temperature at 1/6 Scale, Air Temperature 223K and 1500 mph with Supersonic Inlet and Supersonic Outlet [Diagram: CFD color contour plot of simulated Mach number (dimensionless) around the "Tic Tac" capsule-shaped craft model, with a numeric color-scale legend (values not reliably legible from the scan).] Figure 20. Tic Tac Mach Number at 1/6 Scale, Air Temperature 223K and 1500 mph with Supersonic Inlet and Supersonic Outlet Summai) Report on BAJ\SS llJ\P J\nulysi-. Capabilities Pagr 43 November 23. 20I 0 [PAGE 45] [Diagram: CFD color contour plot of simulated temperature (K) around the right circular cylinder craft model, with a numeric color-scale legend (values not reliably legible from the scan).] Figure 21. Cylinder Temperature at 1/6 Scale, Air Temperature 223K and 700 mph with Mixed Inlet and Supersonic Outlet [Diagram: CFD color contour plot of simulated Mach number (dimensionless) around the right circular cylinder craft model, with a numeric color-scale legend (values not reliably legible from the scan).] Figure 22. Cylinder Mach Number at 1/6 Scale, Air Temperature 223K and 700 mph with Mixed Inlet and Supersonic Outlet Surnma1) R1:port on BAA~S l/AP Analy~i, Capithilitics November 23. 20 I 0 [PAGE 46] [Diagram: CFD color contour plot of simulated pressure (Pa) around the right circular cylinder craft model, with a numeric color-scale legend (values not reliably legible from the scan).] Figure 23. Cylinder Pressure at 1/6 Scale, Air Temperature 223K and 1500 mph with Supersonic Inlet and Supersonic Outlet [Diagram: CFD color contour plot of simulated temperature (K) around the right circular cylinder craft model, with a numeric color-scale legend (values not reliably legible from the scan).] Figure 24. Cylinder Temperature at 1/6 Scale, Air Temperature 223K and 1500 mph with Supersonic Inlet and Supersonic Outlet Summary Report on HAASS UAP Analysi<. Capabilities Page 45 November 23, 2010 [PAGE 47] 2.1~ 2..CMOetOOO 1~ 1.718et000 1e32e+OOO 1496et000 Figure 25. Cylinder Mach Number at 1/6 Scale, Air Temperature 223K and 1500 mph with Supersonic Inlet and Supersonic Outlet 4.1.4 Summary and Conclusions of Compressible umerical Analyses ln the field of UAP studies, it is believed this preliminary analysis of the "Tic Tac" incident is the first of its kind to utilize a multi-industry standard FEA code to perform computational studies. The cases used are provided as a basic demonstration of the CFX fluid flow module and illustrate some ofits capabilities, as well as a sample of some visualization tools. 4.1.4.1 "Tic Tac" Geometry For the contour plots of pressure, temperature from I 00 mph up to 500 mph, gradual increases in values are observed. with the most significant value change at the front of the object. The Mach number values increase at the front sides of the object. Disturbance of air flow is witnessed in the pressure and Mach contour profiles around the body. Nearing the speed of sound al 700 mph, contours for pressure and Mach number started to show a more pronounced shock as would be expected. Temperature values also showed a higher increase at the front nose due to higher flow and air resistance over the body. Velocities higher than 700 mph showed a drastic difference in values compared to those at JOO mph with pressure differences in orders of magnitude. Al I, 100 mph. the temperature rises not only at the attack nose, but started to even increase on the sides and in the wakes of air now. Detached shock waves were witnessed in the pressure and Mach contours starting al 700 mph all the way up to 1.500 mph. Summary Report on BAJ\SS UJ\P J\nal) sis Capabilities Page 46 November 23. 20 I 0 [PAGE 48] 4.1.4.2 Circular Cylinder Geometry It would seem counter intuitive to have a craft with a flat face pushing through the air due to a major increase in air resistance. However, there have been many reports of objects ofjust the sort seen maneuvering in the skies. A comparison of the detrimental aerodynamic effects was sought in relation to the smoother edged body. At lower speeds, no large differences in values of pressures, temperatures or Mach numbers were observed. There were, however, slight differences in the location and profiles of the values of the "Tic Tac" geometry compared to the cylinder. None of these differences would indicate a drastic difference in conventional lift performance between the two geometries. The same appeared to hold true for higher speed scenarios, indicating no significantly different aerodynamic lift advantages between the two geometries. 4.1.4.3 Outcome Success was achieved in implementing the ANSYS Multiphysics and SolidWorks Solid modeling program to create and run input cases for compressible fluid flow over both the "Tic Tac" geometry and that of a right circular cylinder to illustrate pressure, temperature and Mach contour profiles over both shapes. Separated shockwaves were witnessed in higher velocity cases indicating that the possibility of a sonic boom or vibration may have been perturbated into the environment. The actual propagation distance of these was not ofinterest in this study and may be looked at in the future. It is doubtful the aircrew would have felt a shock wave in the cockpit unless extremely close to the object while traveling at high rates of speed, which the fighter jets were not. These basic geometries and assumptions helped provide an excellent starting point to create more complex transient cases that possibly incorporate heat generation, electromagnetic effects, and acoustics. This is demonstrated in a basic model that FEA algorithms describing multiphysics can provide to be an invaluable tool in gaining insight into UAP flight characteristics and even possibly rule out improbable scenarios. 4.1.5 Numerical Analysis of Incompressible Flow of a UAP Entering Water The problem studied was that of a solid disc shaped object descending through the air into a body ofliquid. The model created, details the descent ofa solid disc shaped UAP into water. It is assumed normal ambient conditions with a solid steel disc moving at a speed of 5 mis in the negative y (downward) direction. The water surface is approximately 10 feet below the bottom of the UAP. Water and air te~eratures are held at constant at 25°C and the gravitational acceleration constant at 9.81 mis . Ambient pressure was a constant 1 atm, buoyancy effects within the water were accounted for and the UAP was taken to be isothermal (no heat transfer between the system and the surroundings). Three distinct phases were created; a gaseous phase (air), the solid phase (UAP) and the liquid phase (water). Figure 26 displays the three dimensional geometry depicting the distinct regions and boundaries. The geometry was completed, and the necessary mesh was created in order to carry out the FEA analysis. Meshing is the discretization ofa continuous domain into a set ofdiscrete sub-domains called elements and is shown Figure 27. The governing equations were then solved for all Summary Report on BAASS UAP Analysis Capabilities Page 47 November 23, 20 I 0 [PAGE 49] elements within the domain. The accuracy of the solution increases with increasing number of elements (refining ofthe mesh). Typically, meshes are refined near domain borders or other places of interest; specifically where the solution is desired (for example the edge of solid object where it is desired to determine the amount of heat loss from the object). The solid UAP body was more refined than the air and water domains because it was ofprimary importance to study fluid flow around the UAP and not the flow of air/water further away from the solid domain. A close-up view ofthe refined mesh in the solid UAP domain is seen in Figure 28. Once the mesh was generated, then boundary and initial conditions were assigned to replicate approximate physical conditions during the event. As the name implies, boundary conditions are exact solutions to differential equations that exist on the outskirts of the different geometries. These conditions must be met if the solution is to be correctly determined. Initial conditions are time dependent relationships that describe the initial state of the problem. Thermophysical data must be defined for each domain. The governing equations include the properties of the materials involved (cp, µ, etc.) and an accurate analysis depends as much on the proper accounting ofthese properties as on the proper identification of boundary conditions. Boundary conditions on the solid UAP edges were set as a no slip surface. A no slip boundary sets the fluid velocity at 0. That is to say that a fluid coming in contact with the surface will not move (not slip). This is a typical boundary condition used when a fluid comes in contact with a solid body. In addition, the outside walls of the boundary were set as no slip. It was assumed that the walls were located far enough away from the UAP-water impact zone to play no part in determination of fluid movement around the solid UAP body. Thermophysical data was determined by material identification within the problem setup. The UAP was defined as being made of steel, the liquid body was set as water and the gaseous body was set to air. The initial velocity for the UAP was Omis, that is lo say the UAP initially starts at rest. Total simulation time was set to 10 seconds with 0.2 seconds per time step (for a total of50 time steps). 4.1.6 Numerical Analysis of Incompressible Flow of a UAP Entering Water Results Upon completion of the simulation; an output file was created and stored for use in the post processing portion of Workbench called CFX-IPost. Once the output file has been imported to CFX- Post; a variety of results may be obtained. For this investigation, a fluid dynamic analysis was performed. To best view the results; a plane (parallel to they axis) was created to bisect the geometry (see Figure 29). The creation of a plane contained within the geometry allows for easy analysis of the solution. CFX-Post was used to determine the velocities of the air and water fluid domain, the pressure of the system and through examination of the volume fraction of water; a recreation of the appearance ofa solid entering the water. An animated representation of the transient results was created in an effort to understand how the trends in the specified variable change over time. Figure 30 displays a still image ofan animated result showing how the volume fraction of water changed as the UAP descended into the water domain. Summary Report on BAASS UAP Analysis Capabilities Page 48 November 23, 2010 [PAGE 50] Manipulation of the created plane view allowed for a two dimensional analysis for a variety of parameters. Figure 31 displays a still frame of the animation depicting how pressure varied throughout geometry. Figure 31 displayed the expected trend of an increasing pressure with increasing depth. A re-creation of the physical appearance of the UAP impacting and descending into water may be achieved through analysis of the transient animated results of volume fraction of water. Figure 32 displays a still shot of this animation after the UAP has impacted and entered the water domain. The radially expanding concentric circles display the resulting ripple effect after the solid has penetrated through the surface of the water. Figure 33 displays a side view of the same result. The original result animations from which the still screenshots (Figure 29 through Figure 33) were taken are provided in .mpeg form. Jn addition to the preceding results, several animations depicting transient trends of fluid density and fluid velocity have been provided. Summary Report on BAASS UAP Analysis Capabilities Page 49 November 23, 2010 [PAGE 51] [Diagram: ANSYS 3D solid-geometry rendering of a box-shaped water volume with a small disc embedded near the top surface, with a distance-scale bar in meters (0-70.00 m) and an XYZ axis triad.] Figure 26 Solid Three Dimensional Geometry of Disc and Water Summar: Report on BA.\SS L\P \nal~sis Capabilities Page 50 November 23. 20 l 0 [PAGE 52] Figure 27. Solid Three Dimensional Geometry Mesh of Disc and Water SurnmUI} Rt:pon on BA.ASS CAP Analysis Capabilities Page 51 November 23. 2010 [PAGE 53] [Diagram: ANSYS 3D mesh rendering, close-up view of the solid UAP disc geometry, with a distance-scale bar in meters (0-6.000 m).] Figure 28. Solid Three Dimensional Geometry Mesh of UAP Disc Summar: Report on BA\SS C.\P An::il~sis Capabilities Page 52 , overnber 23. 20 l 0 [PAGE 54] [Diagram: ANSYS 3D rendering showing the user-generated cut analysis plane through the geometry, with a distance-scale bar in meters (0-50.00 m) labeled "y".] Figure 29. User Generated Cut Analysis Plane Summa~ Report on BAASS L AP Anal:sis Capabilities Pagl.! 53 1 ovember 23. 2010 [PAGE 55] [Diagram: ANSYS CFX contour plot titled "Fluid 2 Volume Fraction, Contour 1," a 3D box domain cut away to show a wavy fraction-boundary surface, with a color-scale legend from 1.000e-015 to 1.000e+000, a distance-scale bar in meters (0-40.00 m), and an XYZ axis triad.] Figure 30. Animated Result, Fluid 2 Volume Fraction Summary Report on BA'\S L'/\P Anal)sis Capabilities Page 54 ovember 23. 2010 [PAGE 56] Figure 31 . Total Pressure Around UAP Summar: Report on BAASS CAP Anal~sis Capabilities Page.! 55 No,·ember 23. 2010 [PAGE 57] Figure 32. Water Surface Effects From Solid Impact Summa~ Report on BAASS L' <\P Anal~ sis Capabilities Page 56 November 23. 2010 [PAGE 58] Figure 33. Water Surface Effects From Solid Impact (Side View) Sumn1af} Rcpon on BAASc.; L .\P Analysis Capabilities Pagt! 57 November 13. 2010 [PAGE 59] 4.1.7 Summary and Conclusions ofNumerical Analysis of Incompressible Flow ofa UAP Entering Water Results The CFX-Post generated graphs and animations are illustrative samples of what ANSYS CFX is capable ofproducing. The scenario was chosen due to its simple geometry, boundary conditions and relative ease of computational requirements. A typical problem of this type when solved by hand, would have taken weeks if not longer. This simulation incorporated a fluid dynamic analysis and further analysis may incorporate numerous other multiphysics attributes in the study of UAP. Heat transfer from a craft entering the earth's atmosphere as well as the effects of varying craft size, shape and speed on wave generation during water impact could be studied just as easily. In addition to detennining power requirements, achieved surface temperatures etc., re creations of eyewitness sightings may be. Furthermore, electromagnetic capabilities allow for modeling of possible magnetohydrodynamic (MHD) affects. Electrodynamics can show the energy required to create magnetic fields with different materials as well as the propagation of electromagnetic waves through solid and liquid mediums. Using careful design and properties of human tissue in the program it would be possible to show effects on the human body from heat and high electric fields. Effects, such as increase in body temperature or nervous system interruption may be able to be quantified in ANSYS. This tool can greatly assist in the goal of studying human effects to reverse engineer UAP technology. 4.2 ANALYSES OF SPHERICAL UAPS 4.2.1 Acoustical Analysis of a Spherical USO Over the years, there have also been numerous reports USOs. In 1967, a UFO was reported crashing into Shag Harbour, Nova Scotia. It was reported that hovering and flashing orange lights were present, then it tilted at about a 45 degree angle and entered the water. A yellow light was seen in the water moving and leaving a trail of yellow foam. The Canadian Coast Guard was dispatched but by the time they arrived along with other vessels at the point of entry the yellow foam was all that remained. This is one of very few cases where governmental agency documents have formally declared an unidentified flying object was involved. At least eleven people saw a low-flying lit object head down towards the harbor. Multiple witnesses reported hearing a whistling sound "like a bomb," then a "whoosh," and finally a loud bang. Some reported a flash oflight as the object entered the water. Several interviewed military witnesses, including a diver involved in an attempted recovery, have claimed an alien spacecraft was responsible. It was also claimed by several of the witnesses that the U.S. mili was involved in recovery attempts. The case was also briefly investigated by the 1843(a)(2) UFO study, which offered no explanation. It has been proposed that this type of craft may operate using some sort of electromagnetic frequency based propulsion system to control underwater "flight" and to achieve incredible performance capabil.ities in velocity and acceleration. Summary Report on B/\/\SS UAP Analysis Capabilities Page 58 November 23, 2010 [PAGE 60] The three-dimensional acoustic wave equation 1s given below m the second order partial differential equation: and c= ft where B0 - adiabatic bulk modulus (Pa) c - speed ofsound in medium (mis) p - pressure (Pa) t - time (sec) p - density of mediwn (kg!m3) x - x coordinate y - y coordinate z- z coordinate The following solutions are obtained by separation of variables in different coordinate systems. Phasor solutions result, that is they have an implicit time-dependence factor of eiwt where OJ =2,ifis the angular frequency. The explicit time dependence is given by: p(r,t,k) =Real [p(r,k)e'wt) Here k = ~ is the wav,e number and r is the displacement vector. C In Cartesian coordinates and Cylindrical coordinates respectively: p(r, k) = Ae~kr p(r,k) = A,ti,1>(kr) + B,ti,2>(kr) where the asymptotic approximations to the Hankel functions, when kr ➔ oo, are HJll(kr) ~ {fe l(ltr- w/ 4) Summary Report on BAASS UAP Analysis Capabilities Page 59 November 23, 2010 [PAGE 61] and in Spherical coordinates: p(r, k).,.. Ae*ikr r Depending on the chosen Fourier convention, one ofthese represents an outward traveling wave (real) and the other an unphysical inward travelling wave (imaginary). Assuming USOs operate on a frequency driven system, an ANSYS Multi physics 1/100th scale ¼ symmetry Acoustical full harmonic analyses was performed to study a spherical object of 10 m in both air and water for a range of frequencies at standard conditions. Provided below are contour plots for the real, imaginary and magnitude components of pressure and plots for pressure as a function of radius in Pa. Table 3. Properties ofWater Used for AN SYS Harmonic Analyses Property Value Water Density 1,000 kg/m3 Speed of Sound 1,500 mis Reference Pressure 1 >< 10-e Pa Figure 34 and Figure 35 show the FEA mesh for 25 elements per wavdength and 50 elements per wavelength for a 1,000 Hz analysis. Upon inspection of the maximum pressures shown in Figure 36 and Figure 37, it is apparent the FEA model solution was mesh independent with a pressure of 1,052 Pa for the 25 element per wavelength model and 1, 103 Pa for the 50 element per wavelength model. Generally higher element models for meshes are considered more accurate, but a cost in computational time may be seen in extremely large models. ln the runs performed, the 25 element per wavelength model showed sufficient accuracy and reasonable computation times. As frequency was adjusted higher, the elements per wavelength were adjusted down to limit element numbers. Summary Report on BAASS UAP Analysis Capabilities Page 60 November 23, 2010 [PAGE 62] Figure 34. Mesh Plot for 1,000 Hz with 2 5 Elements per Wavelength in Water Summary Report on BAASS UAP Analysis Capabilities Page 61 November 23. 2010 [PAGE 63] Figure 35. Mesh Plot for 1,000 Hz with 50 Elements per Wavelength in Water Sununary Report on BAASS UAP Anal~sis Capabilities Pagt..: 62 November 23. 20 l 0 [PAGE 64] Figure 36. Contour Plot of Real Component of Pressure (Pa) for 1,000 Hz with 50 Elements per Wavelength in Water Summat} Repon on BA.\SS t.: \P Anal~sis Capabilities Page 63 'o,ember 23. 2010 [PAGE 65] Figure 37. Contour Plot of Real Component of Pressure (Pa) for 1,000 Hz with 50 Elements per Wavelength in Water Summar~ Report on BAASS l'AP Analysis Capabilities Page 64 November 23. 20 I 0 [PAGE 66] Figure 38. Contour Plot of Imaginary Component of Pressure (Pa) for 1,000 Hz with 25 Elements per Wavelength in Water Summar) Report on BA.\SS CAP Anal~sis Capabilities Page 65 '\lo"ember 23. 2.010 [PAGE 67] Figure 39. Contour Plot of the Magnitude of Pressure (Pa) for 1,000 Hz with 25 Elements per Wavelength in Water Summ~ Report on BJ\ I\S, l. \P Anal~c;i!.- Cnpabilities Page 66 November 23. 2010 [PAGE 68] Figure 40. Steady State Real Component of Pressure {Pa) as a Function of Radial Distance {m) Plot for 1,000 Hz with 25 Elements per Wavelength in Water Swnm:lf), Report on B.\..\SS L'AP Anal~sis Capabilities Page 67 10\'ember 23. 2010 [PAGE 69] Figure 41 . Steady State Imaginary Component of Pressure (Pa) as a Function of Radial Distance (m) Plot for 1,000 Hz with 25 Elements per Wavelength in Water Summ..10 Rcpor' on BA \Sl.i CAP Anal~sis Capabilities Page 68 November 23. 2010 [PAGE 70] Figure 42. Steady State Magnitude of Pressure (Pa) as a Function of Radial Distance (m) Plot for 1,000 Hz with 25 Elements per Wavelength in Water SwnmU0 Report on BAASS l'AP Analysis Capabilities Page 69 November 23. 2010 [PAGE 71] Figure 43. Contour Plot of Real Component of Pressure (Pa) for 5,000 Hz with 25 Elements per Wavelength in Water Swnmar: Report on BAASS UAP Anal:,,sis Capabilities Page 70 'ovemher 23. 2010 [PAGE 72] Figure 44. Contour Plot of Imaginary Component of Pressure (Pa) for 5,000 Hz with 25 Elements per Wavelength in Water Summar: Report on 13/\ \SS l \P Analysis Capabilities Pagl! 71 November 23. 2010 [PAGE 73] Figure 45. Contour Plot of the Magnitude of Pressure (Pa) for 5,000 Hz with 25 Elements per Wavelength in Water Summar: Report on BA.ASS L .\P Analysis Capabilities Pag~ T2. November 23. 2010 [PAGE 74] Figure 46. Steady State Real Component of Pressure (Pa) as a Function of Radial Distance (m) Plot for 5,000 Hz with 25 Elements per Wavelength in Water Summ~ Report on BMSS UAP Anal~sis Capabilities Page 73 November 23. 2010 [PAGE 75] Figure 47. Steady State Imaginary Component of Pressure (Pa) as a Function of Radial Distance (m) Plot for 5,000 Hz with 25 Elements per Wavelength in Water Summar: Report on BAASS l AP Anal~sis Capabilities Page 74 November 23. 2010 [PAGE 76] Figure 48. Steady State Magnitude of Pressure (Pa) as a Function of Radial Distance {m) Plot for 5,000 Hz with 25 Elements per Wavelength in Water Summary Report on 81\J\SS UAP Analysis Capabilitil!s Page 75 November 23. 2010 [PAGE 77] Figure 49. Contour Plot of Real Component of Pressure (Pa) for 10,000 Hz with 25 Elements per Wavelength in Water Swnm.10 Report on BA,\<:;S L \P Anal~sis Capabilities Page 76 November 23. 2010 [PAGE 78] Figure 50. Contour Plot of Imaginary Component of Pressure (Pa) for 10,000 Hz with 25 Elements per Wavelength in Water Summar) Report on B \ , \SS LAP Anal~ sis Capabilities Pag1.: 77 ovember 23. 2010 [PAGE 79] Figure 51 . Contour Plot of the Magnitude of Pressure (Pa) for 10.000 Hz with 25 Elements per Wavelength in Water Summar: Repon on BA:\SS LAP AnnJysis Capabilities Page 78 November 23. 2010 [PAGE 80] Figure 52. Steady State Real Component of Pressure (Pa) as a Function of Radial Distance (m) Plot for 10,000 Hz with 25 Elements per Wavelength in Water Summfil), Report on BA,\SS L' '\P An.J~sis Capabilities Page 79 November 23. 2010 [PAGE 81] Figure 53. Steady State Imaginary Component of Pressure (Pa) as a Function of Radial Distance (m) Plot for 10,000 Hz with 25 Elements per Wavelength in Water Sumrnru: Report on B/\.l\SS VAP Analysis Capabilities Page 80 November 23. 2010 [PAGE 82] Figure 54. Steady State Magnitude of Pressure (Pa) as a Function of Radial Distance (m) Plot for 10,000 Hz with 25 Elements per Wavelength in Water Summary Report on BAASS UAP Anal;sis Capabilities Page 81 November 23. 2010 [PAGE 83] 4.2.1.1 Summary and Conclusions of Acoustic Analyses A successful analysis of a USO was conducted using a full harmonic acoustics simulation. The plots of the real and imaginary vaJues showed good agreement with the expected theoretical solutions. It may be concluded from the contour plots and graphs that the varying frequencies produce acoustics pressures far out from the actual source and decline in an inverse square law relationship. In the future, ships and submarines could possibly detect these pressure disturbances and a frequency ofthe mode ofoperation could be calculated with a known distance from the vessel. 4.2.2 ANSYS Multiphysics Electromagnetic Capabilities The electromagnetic capabilities of ANSYS Multiphysics include a full-wave electromagnetic solver applicable to resonant, propagating, radiation and scattering phenomena in the frequency domain. RF or microwave passive components, antennas, attenuators, interconnects and related high frequency structures may be modeled for use in applications of stealth, electronic warfare and directed high energy applications. Post-processing caJculations provide electric and magnetic field intensity, quality factor, scattering matrix parameters, voltage, current, characteristic impedance, radar cross section, far and near electromagnetic fields beyond the modeled domain, antenna patterns, including period structures, and Joule losses (ANSYS, Inc., 2009). Magnetohydrodynamics may also be modeled in development of propulsion units and power generation, electron beam dynamics and electricaJ discharges. The Maxwell Equations below provide the basis for electromagnetic calculations. V. D =Pe aD V x H = J+at aB VxE=- at V· B =0 where: B - magnetic induction field (tesla) D - displacement field (C/m2) E - electric field (V/m) H - magnetic field (Nm) J - current density Pe - charge density Summary Report on BAASS UAP Analysis Capabilities Page 82 November 23, 2010 [PAGE 84] 4.2.3 Radar Cro s Section Analysis of a Spherical UFO M any UAP have been reported across the globe. Pilots have reported seeing these craft in the air, but when asked for confirmation of other aircra!l in the area, air traffic control reports nothing on radar. Only a tiny fraction or energy is bounced back to the receiving antenna, even though many megawatts of power may be transmitted in a single pulse. The amount of power returned from a target lo Lhe transmitting radar depends on four maj or factors: I . The power transmitted in the direction of the ltlrgel. 2. The amount or power that impacts the target and is ref1el:led back in thc direction or thc antcnnu. This is din:l:tly rlllational lo the range between the antenna and target and thc target's RCS. 3. The amount or n.:Jkcted power that is received by the antenna. 4. The length ortime in which the antenna is pointed al the target. [Diagram: illustration of a radar beam as a yellow cone widening from the radar/aircraft toward the target, with four numbered callouts: (1) "Power of Waves Radiated Toward Target", (2) "Fraction of Intercepted Power Scattered Toward Radar", (3) "Fraction of Backscatter Captured by Antenna", (4) "Time on Target" (shown with a clock icon).] Figure 55. Factors that Determine the Energy Returned by a Target (Aerospaceweb.org , 201 0) Power flux is used lo describe the relationship between these variables. The further the radar wave travels, the greater the power transmitted decrease because it is spread over a larger area. The inverse squarc law of the range R or 1/R2 governs the area over which the power is spread from the transmitting radar. The power flux or power density of the transmillcd radar wave at the range of the target has a special name called the incident power density ( Pincldcm) Summary Report on BJ\/\SS U/\P Analysis Capahilitics Page 83 November 2). 2010 [PAGE 85] [Diagram: three-panel illustration. Panel 1: a radar beam cone widening with distance, labeled "Power Density decreases by 1/R2" and "A ∝ R2". Panel 2: a fighter jet reflecting a narrower return beam back toward a distant radar dish, labeled "Power reflected back to the radar depends on the power intercepted by the target and the target orientation". Panel 3: the reflected beam spreading again on its way back to the radar, labeled "Reflected power also spreads equally as it returns to the radar".] Figure 56. Effect of Distance from the radar to the Target on the Power Density (Aerospaceweb.org , 2010) When the radar wave reaches the target, a portion is reflected back to the antenna. l n addition, the reflected power also dissipates at 1/R.2 therefore it is reduced by a factor of 1/R.4 roundtrip by the time it is returned to the antenna. The ability ofa radar system lo detect a target depends on whether the amount or power returned is great enough to be difTerentiated from internal noise, ground clutter, background radiation, and other sources of interference. This is defined as the signal to noise ratio. The object of stealth is to absorb or reflect waves away from receiving antenna and/or jam or propagate a false wave back to its source so that the target is nearly impossible to detect or track. SumnHlr) Report on BAI\SS l AP Analysi" C'apahilitics Page 84 November 23. 2010 [PAGE 86] The amount of power that is reflected back to the radar depends largely on a quantity called the radar cross section (RCS). RCS (cr) is technically an area and typically expressed in square meters (rn2) and depends on the following three factors: Geometric cross section: The area of the object presented to the antenna or projected area is known as the geometric cross section. The area varies depending on the angle, or aspect, seen by the radar. The geometric cross section (A) determines how much power transmitted by the radar (Pincident) is intercepted by the target (Pintercepted) according to the following equation: Pintercepted =APincident Reflectivity: The reflectivity is the fraction of the intercepted power that is reflected by the target, regardless ofdirection. An object doesn' t always reflect equally from all directions as some parts are flat or curved producing varying radar reflection and some of the power is absorbed by the object. Objects that have radar Absorbent Materials (RAM) and radar Absorbent Structures (RAS) are designed using internal reflectors to trap incoming radar waves. The power received by the antenna after scattering or reflecting off the target is equal to the intercepted power less whatever portion of that power is absorbed by the target. The reflectivity is the ratio ofpower scattered by the target (Pscattcr) to the power intercepted by the target (Pintcrccptcd), t . ·t pscatter Reflec LVL y = A Pintercepted Directivity: The directivity is related to reflectivity but refers to the power scattered back in the direction of the receiving antenna. The power that is reflected toward the antenna is called the backscattered power (Pbackscancr), Directivity is the ratio of the power that is backscattered in the direction of the antenna to the power that would have been scattered in that direction ifthe scattering were in fact uniform in all directions. Isotropic power cPisotropic) is the power scattered in a perfect sphere over a unit solid angle ofthat sphere. D. t. ·t Pbackscatter Pbackscatter irec LVL y = p = l isotropic 4rr Pscatter The reflected power will be much greater or much smaller than the isotropic power depending on how the target is oriented to the transmitting antenna. The directivity, therefore, will be much greater than l when the target returns a strong backscatter in the direction of the receiving antenna and much less than I when the backscatter is small. These three factors can be combined to determine the complete RCS (cr) for a target. Summary Report on BAASS UAP Analysis Capabilities Page 85 November 23, 2010 [PAGE 87] RCS= CT= Geometric Cross Section x Reflectivity x Directivity Pbackscatter CT= 4TC Pintercepted The importance of RCS can best be understood by looking at an equation relating the RCS ofthe target to the energy received by the antenna. where S = signal energy received by the radar Pavg =average power transmitted by the radar G = gain ofthe radar antenna er = RCS Ae = effective area of the radar antenna, or "aperture efficiency" to, = time the radar antenna is pointed at the target (time on target) R = range to the target Figure 57 shows a target that presents the same aspect to the radar at ranges from 1 to 50 miles. At a range of 50 miles, the relative power received by the radar is only 0.00000016, or 1.6 x I 07 % of the strength at one mile. This diagram graphically illustrates how significant the effect ofenergy dissipation is with distance, and how sensitive radars must be to detect targets at even short ranges. Summary Report on BAASS UAP A11alysis Capabilities Page 86 November 23, 2010 [PAGE 88] [Diagram: line graph, axes "RECEIVED POWER" (y, 0 to 1.0) vs. "RANGE (MILES)" (x, 0 to 50), showing power dropping sharply from 1.0 near zero range to nearly 0 by about 5 miles and staying near zero out to 50 miles.] Figure 57. Reduction in the Strength of Target Echoes with Range (Aerospaceweb.org , 2010) Furthermore, every radar system has a minimum signal energy it can detect, a quantity called Smin• This minimum signal energy along with antenna design and scan rate determine the maximum range (Rmax) at which a given radar can detect a given target. Summary Report on BAASS UAP Analysis Capabilities Page 87 November 23, 2010 [PAGE 89] [Table/Diagram: "Geometry, Description and Maximum RCS" table with columns Geometry (a line drawing of each shape with an incident-wave arrow), Description, Maximum RCS (formula), and Comments. Rows: (1) Square trihedral corner reflector, sigma = 12*pi*a^4/lambda^2, "Strongest radar return due to triple reflection of incident wave"; (2) Right dihedral corner reflector, sigma = 8*pi*a^2*b^2/lambda^2, "Second strongest radar return due to double reflection of incident wave; decreases from maximum slowly with changing theta and rapidly with changing phi"; (3) Flat plate, sigma = 4*pi*a^2*b^2/lambda^2, "Third strongest radar return due to direct reflection of incident wave; decreases rapidly as incidence angle changes from perpendicular"; (4) Right circular cylinder, sigma = 2*pi*a*b^2/lambda, "Strong radar return as aspect (theta) changes, but decreases rapidly as azimuth (phi) changes"; (5) Sphere, sigma = pi*a^2, "Produces the same isotropic return in all directions."] Figure 58. Geometry, Description and Maximum RCS(Aerospaceweb.org , 2010) Summary Report on BAASS UAP Analysis Capabilities Page 88 November 23, 2010 [PAGE 90] RCS in square meters can be converted to dBsm by the following equation. dBsm = l 0log(RCSmi) It can be difficult to directly compare RCS estimates from one object to another since the RCS varies wildly depending on aspect, radar frequency and wavelength, and the fidelity of the receiver. Figure 59 illustrates typical RCS values for aircraft and other objects, ranging from insects and birds up to large ground vehicles and ships. The RCS ofa stealth aircraft is typically multiple orders of magnitude lower than a conventional plane and is often comparable to that of a small bird or large insect. [Diagram: log-scale bar chart titled "Comparison of Typical Radar Cross Sections in Square Meters," axis from .0001 to 100,000 m2 (X-Band), with bars for Insects, Birds, Light Ground Vehicle, Tank/Armored Vehicle, Fighter, Bomber, Cruise Missile, Surface Ship, and Aircraft Carrier positioned along the scale in roughly that ascending order.] Figure 59. Radar Cross Section Comparison (Aerospaceweb.org , 2010) A one-half symmetry analysis of the radar cross section of a UAP sphere with a dielectric coating was performed. Assuming the bottom limit of an ultrahigh frequency (UHF) very long range radar system is 300 MHz, a full scale RCS full harmonic analysis was performed to study a spherical object of 10 m in air with a 1 m dielectric coating layer. Provided in Figure 64 is a contour plot for the electric field distribution. Figure 60 and Figure 61 show the FEA mesh for 25 elements per wavelength and 50 elements per wavelength for a 300 MHz RCS analysis. Summary Report on BAASS UAP Analysis Capabilities Page 89 November 23, 2010 [PAGE 91] Figure 60. Mesh of ½ Symmetry UFO Sphere with 25 Elements per Wavelength Summar:- Report on BAASS CAP Anal) sis Capabilities Page 90 November 23. 20 I 0 [PAGE 92] Figure 61. Mesh of½ Symmetry UFO Sphere with 50 Elements per Wavelength Summary Report on B .\. \SS C I\P Analysis Capabilities Page 91 ovember 23. 2010 [PAGE 93] Table 4. Normalized radar Cross Section for a 10 m Metallic Sphere with a 1 m Dielectric Coating in Decibels for 300 MHz and 25 Elements per Wavelength PHI (Deg) THETA (Deg) Normalized RCS (dB) 0. 000 0. 000 -0. 17461E+01 0. 000 5. 000 -0. 18396E+01 0. 000 10.000 -0 20891E+01 0. 000 15. 000 -0 24059E-t-OI 0. 000 20. 000 -0 26306E+01 0. 000 25 000 -0. 25683E+Ol 0. 000 30. 000 -0. 21056E+01 0. 000 35. 000 -0. 13090E+OI 0. 000 40. 000 -0. 36528E+OO 0. 000 45. 000 0.54501E+OO 0. 000 50. 000 0. 13011E+OI 0. 000 55. 000 0. 18315E-t 01 0. 000 60. 000 0. 20883E+OI 0. 000 65. 000 0. 20270E+01 0. 000 70 000 0. 15903E+01 0. 000 75. 000 0. 69095E+OO 0. 000 80. 000 -0. 81414E+OO 0. 000 85. 000 -0. 31541E+OI 0. 000 90.000 -0. 64801E+OI 0. 000 95. 000 -0. 85723E+OI 0.000 100. 000 -0. 64262E+OI 0. 000 105. 000 -0. 16586E+O I 0. 000 110 000 0 10839E+OI 0. 000 115. 000 0. 29983E-t-OI 0. 000 120. 000 0. 43027E+01 0. 000 125. 000 0. 51444E+OI 0. 000 130. 000 0. 56415E+01 0. 000 135. 000 0. 59202E+OI 0. 000 140. 000 0. 6l375E+01 0. 000 145. 000 0. 64662E+01 0. 000 150. 000 0. 70226E+01 0. 000 155.000 0. 77921E+01 0. 000 160. 000 0. 86493E+01 0. 000 165. 000 0. 94471E-t0I 0. 000 170. 000 0. l0076E+02 0. 000 175.000 0 10474E+02 0. 000 180.000 0. l0609E+02 Summar) Report on BAASS lJAP Analysi" Capahilities Page 92 Novcmhc, 21. 20 I 0 [PAGE 94] Figure 62. Normalized radar Cross Section Plot for a½ Symmetry 10 m Metallic Sphere with a 1 m Dielectric Coating in Decibels for 300 MHz and 25 Elements per Wavelength ~ummai:, Report on B \J\SS L '\P Anal~sis Capabilities Page 93 ovember 23. 2010 [PAGE 95] Table 5. Normalized radar Cross Section for a 10 m Metallic Sphere with a 1 m Dielectric Coating in Decibels for 300 MHz and 50 Elements per Wavelength PHI (Deg) 0.000 0. 000 0.000 0. 000 0. 000 0. 000 0. 000 0. 000 0. 000 0. 000 0. 000 0. 000 0.000 0.000 0. 000 0 000 0 000 0 000 0. 000 0. 000 0. 000 0. 000 0 000 0 000 0 000 0 000 0 000 0.000 0.000 0. 000 0.000 0.000 0. 000 0.000 0 000 0.000 0.000 THETA (Deg) 0. 000 5. 000 10. 000 15. 000 20 000 25. 000 30. 000 35. 000 40. 000 45. 000 50. 000 55. 000 60. 000 65 000 70. 000 75 000 80. 000 85. 000 90. 000 95. 000 100 000 105 000 110 000 115 000 120. 000 125 000 130 000 135. 000 140. 000 145. 000 150.000 155.000 160 000 165 000 170. 000 175.000 180. 000 Normalized RCS (dB) -0. 13803E+OI -0. 14503E+01 0 16341E+01 -0. 18535E+01 -0. 19807E+Ol -0. 18742E+-01 -0. 14592E+-01 -0. 78502E+OO 0. 11714E-01 0. 78777E+OO 0. 14360E+-OI 0. 18849E+-O1 0. 20821E+01 0. 19780E-t01 0 15109E+01 0 58974E+OO -0. 93250E+OO -0. 32902E+01 -0. 66390E+0I -0. 87047E+0I 0 54874E+01 0 17016E+01 0. 10488E+0l 0 29700E+0l 0. 42801E+01 0. 51239E+01 0. 56159E+01 0. 58773E+01 0. 60608E+0I 0. 6341 IE+0I 0. 68464E+01 0. 75769E+-01 0 84125E+01 0 92021E+-01 0 98300E+-01 0. 10228E+02 0. 10364E+02 Summar) Report on Bl\\~~ I /\P Analysis Capabilities Page Q.:.f Novcmbct 23. 20I 0 [PAGE 96] Figure 63. Normalized radar Cross Section Plot for a ½ Symmetry 10 m Metallic Sphere with a 1 m Dielectric Coating in Decibels for 300 MHz and 50 Elements per Wavelength Summa~ Report on BA.l\.SS C \.P Anal~sis Capabilities Page 95 ovember 13. 1010 [PAGE 97] Figure 64. Electric Flied Contour in V/m for a ½ Symmetry 10 m Metallic Sphere with a 1 m Dielectric Coating in Decibels for 300 MHz and 25 Elements per Wavelength Summary Report on BA1\SS l '_\P Anal~sis Capabilities Page 96 ovember 23. 2010 [PAGE 98] 4.2.3.1 Summary and Conclusions of RCS Analysis A successful analysis of a spherical UAP RCS was conducted using a full harmonic electromagnetic simulation. Upon inspection of the values of normalized RCS at 90°, the dB shown in Table 4 and Table 5, it is apparent the FEA model solution was mesh independent with a pressure of -0.64801 E+0l dB for the 25 element per wavelength model and -0.66390E+0l dB for the 50 element per wavelength model. In the runs performed, the 25 element per wavelength model showed sufficient accuracy and reasonable computation times. The normalized RCS plots and electric field contour illustrate the variation of RCS dB and V /m values over a range of0 to 180°. As one would expect, the values are largest at the point of incident of the radar wave and some reflection and also decrease in magnitude were witnessed around the sphere. Various shapes of UAPs may be evaluated for RCS and the resulting electric field due to an incidental radar wave is also attainable. This information may be used in the future for cases reported to determine the prominence of an object's expected RCS and whether similar radar returns were received. Summary Report on BAASS UAP Analysis Capabilities Page 97 November 23, 2010 [PAGE 99] 5. SUMMARY AND CONCLUSION Compressible and incompressible fluid flow, dynamics, acoustics and radar theory all were provided in this report to give the reader a brief overview and understanding of the numerous physical equations that may be applied to reported UAP and USO behavior. Numerical solutions to these partial differential equation systems (many of which do not posses analytical or closed form solutions) which describe the physics of the event are achieved with millions ofelements to model the object domain and medium. Each element may have numerous sets of coupled physical equations that need be solved by passing through many different computational iterations until convergence is achieved. BAASS is one of the few companies possessing the expertise, computer software and computational platforms to achieve such sophistication in numerical studies of UAP. Compressible fluid flow analyses were performed to calculate and visualize the steady state pressure, temperature and Mach number contours around two non- conventional craft shapes. A solid disc shaped object descending through the air into a body of liquid was investigated to provide visual simulation of the distmbancc produced on the surface of the water through use of incompressible fluid flow. The USO analyses were performed using a full harmonic acoustics simulation and a spherical UAP RCS model was completed using a full harmonic electromagnetic simulation. For the individual summary and conclusions of each analytical and numerical study, see Sections 4.1.2, 4.1.4, 4.1.7, 4.2.1.1, and 4.2.3.1 ofthis report. From a more general perspective, BAASS was created in 2008 in order to facilitate the long term research and development of novel and emerging future technologies worldwide as they specifically relate to air and spacecraft.. A large component of the BAASS mission is to study in depth the performance characteristics of UAP and USOs. From the data accrued, it is also BAASS's mission to produce a Threat Assessment of UAP and USO performance and capabilities. As a first step in accomplishing this mission BAASS has I) acquired significant field data collection capabilities, both human and instrumented, 2) built the largest known UAP performance and behavior Data Warehouse in the world and 3) acquired advanced computational ability to analyze the data accrued. Research and development necessary for the procurement of the technology required for advanced space and weapons systems are conducted through use of computational Multiphysics FEA, development of computer code, experimentation, material science testing and manufacturing of prototypes in both BAASS in-house and collaborating facilities and laboratories. Academic areas of concentration include Computational Fluid Dynamics (CFD), Heat Transfer, Nuclear Engineering, Electromagnetics and Radio Frequencies (RF), Theoretical and Computational Physics, Biological Sciences and Chemistry. Theoretical and computational applications, as well as experimentation on components of non-conventional propulsion systems is under way to provide for future development of vehicles that are capable of operating in the atmosphere, under water and in space. Operation of the vehicle in different mediums, as well as a goal of hypersonic flight would provide superior performance in its ability to reach intended targets, faster delivery of weapons, greater effective Summary Report on BAASS UAP Analysis Capabilities Page 98 November 23,2010 [PAGE 100] range and an engagement capability enabling employment of complex tactics against multiple targets across multiple domains. This research intends to provide innovative approaches and concepts for aircraft, propulsion, and flight technologies that demonstrate significant advances in performance and capabilities beyond those in operation today. This report outlined software, equipment and database descriptions along with select theory, analytical and numerical solutions for UAP incidents through engineering and physics analyses. Many analyses of UAP may use analytical or closed form solutions to solve the equations that describe the physics of an event. Where analytical solutions do not exist or the geometry is too complex, BAASS incorporates ANSYS Multiphysics to provide a powerful computational platform to solve large problems numerically, while combining and solving many different physical equations. The combination of computational software with field measurement equipment and historical databases of UAP events allows BAASS to utilize state of the art engineering techniques and tools to assess the operational capabilities of UAP and USOs. A greater understanding of these objects will allow for an accurate threat assessment, as well as provide the physics behind the incredible performance attributes that some have displayed. BAASS' acquired knowledge and capabilities are leading the way to quantum leaps in technology for travel in the atmosphere, space and under water, along with advances in armament and defense systems. Summary Report on BAASS UAP Analysis Capabilities Page 99 November 23, 2010 [PAGE 101] 6. REFERENCES 1843(a)(2) Summary Report on BAASS UAP Analysis Capabilities Page 100 November 23, 2010 [PAGE 102] 1843(a)(2) Summary Report on BAASS UAP Analysis Capabilities Page IOI November 23, 2010 [PAGE 103] SYMBOLS AND ACRONYMS A - Area AAV - anomalous aerial vehicle ~ - effective area of the radar antenna, or "aperture efficiency" B - magnetic induction field BAASS - Bigelow Aerospace Advanced Space Studies Ba - adiabatic bulk modulus c - speed ofsound in medium CFO - computational fluid dynamics CSG - Carrier Strike Group D - displacement field DIA - Defense Intelligence Agency E - electric field FEA - Finite Element Analysis FLIR - forward looking infrared fluid structure interaction g - gravitational acceleration G - gain ofthe radar antenna GB - gigabyte gx - x directional component ofgravitational acceleration gy - y directional component ofgravitational acceleration gz - z directional component ofgravitational acceleration H - magnetic field HOV - High Definition Video J - current density k - wave number Summary Report on BAASS UAP Analysis Capabilities Page 102 November 23,2010 [PAGE 104] M - molar mass MHD - magnetohydrodynamics p - pressure Pavg - average power transmitted by the radar Pbackscatter - backscattered power Pincidcnt - incident power density Pin1ercep1ed - power intercepted by the target Pisotropic - isotropic power Pscauer - power scattered by the target R - range to the target Rmax - maximum range Ru - gas constant radar - radio detection and ranging RCS - radar cross section RF - radio frequency S - signal energy received by the radar Smin - minimum signal energy T - temperature TB - terabyte t - tirne t01 = time the radar antenna is pointed at the target (time on target) u - x velocity v -y velocity w - z velocity x - x coordinate y - y coordinate z - z coordinate Summary Report on BAASS UAP Analysis Capabilities Page 103 November 23, 2010 [PAGE 105] UAP - unidentified aerial phenomena UAV - unmanned aerial vehicle UFO - unidentified flying object UHF - ultra high frequency USO - unidentified submerged object E - specific internal energy µ - dynamic viscosity ofthe fluid p - density ofthe fluid Pe - charge density cr - radar cross section w - angular frequency Summary Report on BAASS UAP Analysis Capabilities Page 104 November 23, 2010 [PAGE 106] ATTACHMENT I - ANSYS INPUT FILES USO ANSYS Multiphysics Acoustics Input File Example !----------------------------------------------------------- ! 1/100th Acoustical Model ofa IO m Spherical USO in Water ! at 1000 Hz !----------------------------------------------------------- !----------------------------------------------------------- ! Define variables for problem: ! Radiating Sphere ofRadius SPHRRADS with uniform surface ! velocity ofVELOCITY oscillating at FREQUENC !----------------------------------------------------------- *set,FREQUENC, 1000 *set,VELOCITY,0.005 *set,Pl ,acos(-1) *set,SPHRRADS,0. 1 *set,TOLER,0.0001 !----------------------------------------------------------- ! Fluid properties: ! Density, Speed of sound in water, Reference pressure !----------------------------------------------------------- *set,W ATRDENS, 1000 *set, W ATRSONC, 1500 *set,REFEPRES, 1 E-6 !----------------------------------------------------------- ! Geometry info ! Infinite radius at INFIRADS meters ! INFIXOFF, TNFJYOFF not used right now... !----------------------------------------------------------- *set,TNFIRADS,5 *set,INFIXOFF,0.0 *set,TNFIYOFF,0.0 !----------------------------------------------------------- ! Mesh info ! Use mapped mesh? YES=l NO=0 (use NO for now) ! Elements per wavelength (EPW) !----------------------------------------------------------- *set,MAPDMESH,0 *set,TRIMESII , I *set,EPW ,50 Summary Report on BAASS UAP Analysis Capabilities Page 105 November 23, 2010 [PAGE 107] !----------------------------------------------------------- ! Graphics settings ! Set title and subtitles ! Make sure the legend is always on (/plopt,info,on) Put global triad at right top corner (/triad,rtop) ! Turn on Full Graphics because of DDTSREP#16215 !----------------------------------------------------------- /title,Uniformly Radiating Sphere, EPW=%EPW% /stitle, I ,Sphere radius of %SPHRRADS%m /stitle,2,Frequency at %FREQUENC%Ilz /stitle,3,Uniform velocity of%VELOCITY%m/s /stitle,4,Infinite Boundary of%INFIRADS%m at (%INFIXOFF%,%1NFIYOFF%) /plopt,info,on /triad,rtop /graphics,full !----------------------------------------------------------- 1Enter Preprocessor !----------------------------------------------------------- /prep7 !----------------------------------------------------------- 1 Define elements I I = fluid w/ structure ! 2 =fluid no structure I 3 =infinite fluid ! Define elements and keyopts (et) (keyopt) I Define real constants (r) ! Define material properties (mp) !----------------------------------------------------------- et, 1,fluid29 keyopt, 1,2,0 kcyopt, 1,3, 1 et,2,fluid29 keyopt,2,2, 1 keyopt,2,3, 1 et,3,fluid 129 keyopt,3,3, 1 r,1,REFEPRES r,2,REFEPRES r,3,INFIRADS,0,0, mp,dens, I, WATRDENS mp,sonc, 1, WATRSONC mp,dens,2,WATRDENS Summary Report on BAASS UAP Analysis Capabilities Page 106 November 23, 20 I 0 [PAGE 108] mp,sonc,2,W ATRSONC mp,sonc,3, W ATRSONC !----------------------------------------------------------- ! Create geometry ! Create five 90 degree quarter circles (pcirc) ! Merge keypoints (nummrg,kp) !----------------------------------------------------------- pcirc, 1,SPHRRADS,0,90, pcirc,2, 1,0,90, pcirc,3,2,0,90, pcirc,4,3,0,90, pcirc,5,4,0,90, nummrg,kp !----------------------------------------------------------- ! Mesh Set global element size based on EPW above Map with quads, quad-dominant for free mesh (mshape,0) Mesh mapped or free (mshkey) Set area attributes (aatt) ! Mesh all areas (amesh) ! Set plot controls based on element type number !----------------------------------------------------------- esize,(W ATRSONC/FREQUENC)/EPW mshape, TRI MESH mshkey,MAPDMESH aatt,2,2,2 amesh,all /pnum,type,1 /num,1 /auto eplot !----------------------------------------------------------- ! Rotate all nodes in cylindrical CS !----------------------------------------------------------- csys,1 nrotate,all !----------------------------------------------------------- ! Change elements near center to fluid with struct present !----------------------------------------------------------- type,1 real, I mat,1 Summary Report on BAASS UAP Analysis Capabilities Page 107 November 23, 2010 [PAGE 109] nsel,s,loc,x,SPHRRADS esln nsle emodif,all !----------------------------------------------------------- ! Apply struct boundary conditions on element type I ! Constrain all translation DOF (the "free" DOF) ! Reapply velocity as displacement on inner nodes in radial dir. (ux) ! Apply FSI (fluid-struct interface) flag to active !----------------------------------------------------------- d,all,uy d,all,ux nsel,s,loc,x,SPHRRADS d,all,ux,0,-VELOCITY /(2*PJ*FREQUENC) sf,all,fsi !----------------------------------------------------------- ! Mesh Infinite fluid domain ! Instead of meshing, use ESURF to generate elements on existing mesh 1----------------------------------------------------------- type,3 real,3 mat,3 esel,all nsel,s,loc,x,INFlRADS,fNFlRADS+ TOLER esurf,all allsel,all finish !----------------------------------------------------------- ! solution options ! Full harmonic analysis ! frequency at FREQUENC ! select everything & solve !----------------------------------------------------------- /solu antype,harm hropt,fu ll hrout,on lumpm,0 eqslv,sparse harfrq,FREQUENC nsubst, Summary Report on BAASS UAP Analysis Capabilities Page 108 November 23, 2010 [PAGE 110] kbc,0 allsel,all solve finish !----------------------------------------------------------- ! postprocessing w/ annotations ! Load real (set, I, I, 1,0) and plot pressure ! Load imag (set, 1, 1, 1, I) and plot pressure l do a load case comb. to SRSS for pressure magnitude !----------------------------------------------------------- /post) /tsp,,0.75 /ann,delc /tla,-.90,.90,Plot ofreal part ofpressure /dscale, l ,o1T set,l,1,1,0 plnsol,pres /tsp,,0.75 /ann,dele /tla,-.90,.90,Plot of imag part of pressure set, I , 1, 1, l /replot /tsp,,0.75 /ann,dele /tla,-.90,.90,Plot of magnitude of pressure lcdef, 1, 1, 1,0 lcoper,srss, 1 /replot !----------------------------------------------------------- ! path operations !----------------------------------------------------------- csys,0 lsel,s,loc,x,0 nsll,s, 1 •get,NCOUNT,node,,count csys,1 nsel,s,loc,x,SPHRRADS nsel,r,loc,y,90,90+'fOLER STRTNODE=ndnext(0) nsel,s,loc,x,IN FIRADS,INFIRADS+ TOLER nsel,r,loc,y, 90,90+ TOLER FININODE=ndnext(0) Summary Report on BA/\SS UAP Analysis Capabilities Page 109 November 23, 2010 [PAGE 111] allsel,all path,RADIAL,2,30,(NCOUNT-1) ppath,1,STRTNODE ppath,2,FININODE avprin,0,0, set, 1, 1,1, 0 pdef,REALPRES,pres,,noavg set,1,1, 1, 1 pdef,IMAGPRES,pres,,noavg paget,tracpoin,poin paget,tracdata,tabl paget,traclabl,labe *dim,RADSPATH,table,NCOUNT,7 *do,ICOUNT,l ,NCOUNT WAVENUMB=2*Pl*FREQUENC/WATRSONC CURRRADS=TRACDATA(ICOUNT,2, 1) TEMPAMPL=WATRDENS*WATRSONC*VELOCITY*WAVENUMB*(SPHRRADS**2)/CURRRA DS TEMPAMPL=TEMPAMPL/(1 +(WAVENUMB*SPHRRADS)**2) TEMPAMRC=WAVENUMB"'SPHRRADS•cos(WA VENUMB"'(CURRRADS-SPHRRADS)) TEMPAMRS=sin(W A VENUMB*(CURRRADS-SPHRRADS)) TEMPAMJC=cos(WAVENUMB"'(CURRRADS-SPHRRADS)) TEMPAMIS=-WAVENUMB*SPHRRADS*sin(WAVENUMB*(CURRRADS-SPHRRADS)) RADSPATH(JCOUNT, 1 )=TRACDA TA(ICOUNT,2, 1) RADSPATH(ICOUNT,2)=TRACDATA(ICOUNT,5, l) RADSPATH(ICOUNT,3)=TEMPAMPL*(TEMPAMRC+TEMPAMRS) RADSPATH(JCOUNT,4)=TRACDATA(ICOUNT,6,1) RADSPATH(ICOUNT,S)=TEMPAMPL*(TEMPAMIC+TEMPAMIS) RADSPATH(ICOUNT,6)=sqrt(TRACDATA(ICOUNT,5, l )**2+ TRACDAT A(ICOUNT,6, 1 )** 2) TEMP I =TEMPAMPL"'(TEMPAMRC+TEMPAMRS) TEMP2 =TEMPAMPL *(TEMP AMIC+ TEMP AMIS) RADSPATH(ICOUNT,7)=sqrt(TEMP1 "'*2+TEMP2**2) *enddo /gcolumn,1,ANSYS /gcolurnn,2,Theory /axlab,x,Radial Distance (m) /axlab,y,Real Pressure (Pa) *vplot,RADSPATH(l , I ),RADSPATH( 1,2),3 /axlab,y,lmaginary Pressure (Pa) Summary Report on BAASS UAP Analysis Capabilities Page 110 November 23, 2010 [PAGE 112] *vplot,RADSPATH(t, 1 ),RADSPATH(1,4 ),5 /axlab,y,Magnitude ofPressure (Pa) *vplot,RADSP A TH(1, 1 ),RADSPATH(1,6), 7 Summary Report on BAASS UAP Analysis Capabilities Page 111 November 23, 2010 [PAGE 113] UAP ANSYS Multiphysics RCS Input File Example /batch,list /title, RCS ofa Dielectric-coated Metallic Sphere for 300 MHZ UHF /com, Problem: A metallic sphere (radius=5.0m) coated by dielectric layer /com, (thickness=l.0m, Er=4) /com, Incident Wave: -x polirazation with PHI = 0 (degree), THETA = 0 (degree) /nopr /prep7 I problem dimensions and set-up freq=300e6 lambda=3 .e8/freq epsr=4 wave 1 =lambda/sqrt( epsr) wave2=lambda hl=wavel/25 h2=wave2/25 ra=0.5 * lambda s=0.01 *lambda rb=ra+s a=rb+4*h2 b=a+3*h2 c=b+4*h2 ! --- define elements and materials -- et, 1,HF 119, 1 Summary Report on BAASS UAP Analysis Capabilities Page 112 November 23, 2010 [PAGE 114] et,2,HF 119, 1,,, I mp,murx, I, I. mp,perx, l ,epsr mp,murx,2, 1. mp,perx,2, 1. ! --- set up the geometry -- sphcrc,ra,rb,O,180 sphere,rb,a,O, 180 vsel,all cm,vequi,volu block,-b,b,O,b,-b,b block,-c,c,O,c,-c,c vsbv ,4,3,,delete,keep vsbv ,3, vequi,,dclctc,kecp csys,2 vsel,s,loc,x,O,ra/2 vdel,all alls csys,O vglue,all ! --- meshing -- csys,O smrtsize,4 ! meshing esize,hl Summary Report on BAASS UAP Analysis Capabilities Page 113 November 23, 2010 [PAGE 115] type, I mat,1 vmesh,I mat,2 esize,h2 vmesh,3 esize,h2 vmesh,6 ! --- PML element -- type,2 vmesh,5 alls nummrg,all ! define equivalent source surface csys,2 nsel,s,loc,x,O,a esl n,s, I,all nsel,s,loc,x,a sf,all,mxwf alls ! define boundary condition csys,O nsel,s,loc,x,c nsel,a,loc,x,-c Summary Report on BAASS UAP Analysis Capabilities Page 114 November 23, 2010 [PAGE 116] nsel,a,loc,y ,c nsel,a,loc,z,-c nsel,a,loc,z,c d,all,ax,O. nsel,all csys,2 nsel,s,loc,x,ra d,all,ax,O. csys,0 allsel,all ! incident plane wave plwave,-1,0,0,0,0 fini /solu hfscat,scat eqslv,sparse antype,harmic harfrq,freq solve fini /postl set, 1, 1 hfsym,,,pmc prfar,rcsn,total,0,0,,0, 180,36 /yrange,-35, 15 plfar,rcsn,total,0,0,,0, 180,180 fini Summary Report on B/\J\SS UAP Analysis Capabilities Page 115 November 23, 2010 [PAGE 117] [Diagram: CFD color contour plot of simulated pressure (Pa) around the "Tic Tac" capsule-shaped craft model, with a numeric color-scale legend (values not reliably legible from the scan).] Figure 65. Tic Tac Pressure at 1/6 Scale, Air Temperature 223K and 100 mph with Subsonic Inlet and Subsonic Outlet [Diagram: CFD color contour plot of simulated temperature (K) around the "Tic Tac" capsule-shaped craft model, with a numeric color-scale legend (values not reliably legible from the scan).] Figure 66. Tic Tac Temperature at 1/6 Scale, Air Temperature 223K and 100 mph with Subsonic Inlet and Subsonic Outlet Summary Report on BAASS lJAP Analysis Capabilities Page 116 November 23, 2010 [PAGE 118] [Diagram: CFD color contour plot of simulated Mach number (dimensionless) around the "Tic Tac" capsule-shaped craft model, with a numeric color-scale legend (values not reliably legible from the scan).] Figure 67. Tic Tac Mach Number at 1/6 Scale, Air Temperature 223K and 100 mph with Subsonic Inlet and Subsonic Outlet [Diagram: CFD color contour plot of simulated pressure (Pa) around the "Tic Tac" capsule-shaped craft model, with a numeric color-scale legend (values not reliably legible from the scan).] Figure 68. Tic Tac Pressure at 1/6 Scale, Air Temperature 223K and 200 mph with Subsonic Inlet and Subsonic Outlet Summary Report on BA.ASS UAP Analysis Capabilities Page I17 November 23,2010 [PAGE 119] [Diagram: CFD color contour plot of simulated temperature (K) around the "Tic Tac" capsule-shaped craft model, with a numeric color-scale legend (values not reliably legible from the scan).] Figure 69. Tic Tac Temperature at 1/6 Scale, Air Temperature 223K and 200 mph with Subsonic Inlet and Subsonic Outlet [Diagram: CFD color contour plot of simulated Mach number (dimensionless) around the "Tic Tac" capsule-shaped craft model, with a numeric color-scale legend (values not reliably legible from the scan).] Figure 70. Tic Tac Mach Number at 1/6 Scale, Air Temperature 223K and 200 mph with Subsonic Inlet and Subsonic Outlet Summary Report on BA/\SS UAP Analysis Capabilities Page 118 November 23. 2010 [PAGE 120] [Diagram: CFD color contour plot of simulated pressure (Pa) around the "Tic Tac" capsule-shaped craft model, with a numeric color-scale legend (values not reliably legible from the scan).] Figure 71. Tic Tac Pressure at 1/6 Scale, Air Temperature 223K and 300 mph with Subsonic Inlet and Subsonic Outlet [Diagram: CFD color contour plot of simulated temperature (K) around the "Tic Tac" capsule-shaped craft model, with a numeric color-scale legend (values not reliably legible from the scan).] Figure 72. Tic Tac Temperature at 1/6 Scale, Air Temperature 223K and 300 mph with Subsonic Inlet and Subsonic Outlet Summar) Report on BAA<.;<.; llAP Anal~ si, Capahilitics Page I 19 November 21. 20 I 0 [PAGE 121] [Diagram: CFD color contour plot of simulated Mach number (dimensionless) around the "Tic Tac" capsule-shaped craft model, with a numeric color-scale legend (values not reliably legible from the scan).] Figure 73. Tic Tac Mach Number at 1/6 Scale, Air Temperature 223K and 300 mph with Subsonic Inlet and Subsonic Outlet [Diagram: CFD color contour plot of simulated pressure (Pa) around the "Tic Tac" capsule-shaped craft model, with a numeric color-scale legend (values not reliably legible from the scan).] Figure 74. Tic Tac Pressure at 1/6 Scale, Air Temperature 223K and 400 mph with Mixed Inlet and Subsonic Outlet Summary Report on BA \SS llJ\P Anal) sis Capabilities Page 120 No,·cmbcr 23, 20 I 0 [PAGE 122] [Diagram: CFD color contour plot of simulated temperature (K) around the "Tic Tac" capsule-shaped craft model, with a numeric color-scale legend (values not reliably legible from the scan).] Figure 75. Tic Tac Temperature at 1/6 Scale, Air Temperature 223K and 400 mph with Mixed Inlet and Subsonic Outlet [Diagram: CFD color contour plot of simulated Mach number (dimensionless) around the "Tic Tac" capsule-shaped craft model, with a numeric color-scale legend (values not reliably legible from the scan).] Figure 76. Tic Tac Mach Number at 1/6 Scale, Air Temperature 223K and 400 mph with Mixed Inlet and Subsonic Outlet Summary Report on I1AI\SS l lAP Anal) si-; Capabilitic~ Page 121 November 23. 20 10 [PAGE 123] [Diagram: CFD color contour plot of simulated pressure (Pa) around the "Tic Tac" capsule-shaped craft model, with a numeric color-scale legend (values not reliably legible from the scan).] Figure 77. Tic Tac Pressure at 1/6 Scale, Air Temperature 223K and 500 mph with Mixed Inlet and Subsonic Outlet [Diagram: CFD color contour plot of simulated temperature (K) around the "Tic Tac" capsule-shaped craft model, with a numeric color-scale legend (values not reliably legible from the scan).] Figure 78. Tic Tac Temperature at 1/6 Scale, Air Temperature 223K and 500 mph with Mixed Inlet and Subsonic Outlet Summary Report on B/\/\SS t 1•\P Anal) si, ('apahilities Page 12? November 23, 2010 [PAGE 124] [Diagram: CFD color contour plot of simulated Mach number (dimensionless) around the "Tic Tac" capsule-shaped craft model, with a numeric color-scale legend (values not reliably legible from the scan).] Figure 79. Tic Tac Mach Number at 1/6 Scale, Air Temperature 223K and 500 mph with Mixed Inlet and Subsonic Outlet [Diagram: CFD color contour plot of simulated pressure (Pa) around the "Tic Tac" capsule-shaped craft model, with a numeric color-scale legend (values not reliably legible from the scan).] Figure 80. Tic Tac Pressure at 1/6 Scale, Air Temperature 223K and 900 mph with Supersonic Inlet and Supersonic Outlet Summary Report on BAASS l AP l\nal)sis Capabilities Page 1:n November 23. 2010 [PAGE 125] [Diagram: CFD color contour plot of simulated temperature (K) around the "Tic Tac" capsule-shaped craft model, with a numeric color-scale legend (values not reliably legible from the scan).] Figure 81. Tic Tac Temperature at 1/6 Scale, Air Temperature 223K and 900 mph with Supersonic Inlet and Supersonic Outlet [Diagram: CFD color contour plot of simulated Mach number (dimensionless) around the "Tic Tac" capsule-shaped craft model, with a numeric color-scale legend (values not reliably legible from the scan).] Figure 82. Tic Tac Mach Number at 1/6 Scale, Air Temperature 223K and 900 mph with Supersonic Inlet and Supersonic Outlet Summary Report on DA/\SS UAP t\nalysis Capahilitics Page 124 November 23. 20 I 0 [PAGE 126] [Diagram: CFD color contour plot of simulated pressure (Pa) around the "Tic Tac" capsule-shaped craft model, with a numeric color-scale legend (values not reliably legible from the scan).] Figure 83. Tic Tac Pressure at 1/6 Scale, Air Temperature 223K and 1100 mph with Supersonic Inlet and Supersonic Outlet [Diagram: CFD color contour plot of simulated temperature (K) around the "Tic Tac" capsule-shaped craft model, with a numeric color-scale legend (values not reliably legible from the scan).] Figure 84. Tic Tac Temperature at 1/6 Scale, Air Temperature 223K and 1100 mph with Supersonic Inlet and Supersonic Outlet Summary Report on BAA<;S U,\P Anal) 5is Capabilities Page 125 No,cmhcr 21. 2010 [PAGE 127] [Diagram: CFD color contour plot of simulated Mach number (dimensionless) around the "Tic Tac" capsule-shaped craft model, with a numeric color-scale legend (values not reliably legible from the scan).] Figure 85. Tic Tac Mach Number at 1/6 Scale, Air Temperature 223K and 1100 rmph with Supersonic Inlet and Supersonic Outlet [Diagram: CFD color contour plot of simulated pressure (Pa) around the "Tic Tac" capsule-shaped craft model, with a numeric color-scale legend (values not reliably legible from the scan).] Figure 86. Tic Tac Pressure at 1/6 Scale, Air Temperature 223K and 1300 mph with Supersonic Inlet and Supersonic Outlet $um mm) Report on f3AJ\SS UAP Anal) sis Capabilities Page 126 No, cmbcr 23, 2010 [PAGE 128] [Diagram: CFD color contour plot of simulated temperature (K) around the "Tic Tac" capsule-shaped craft model, with a numeric color-scale legend (values not reliably legible from the scan).] Figure 87. Tic Tac Temperature at 1/6 Scale, Air Temperature 223K and 1300 mph with Supersonic Inlet and Supersonic Outlet [Diagram: CFD color contour plot of simulated Mach number (dimensionless) around the "Tic Tac" capsule-shaped craft model, with a numeric color-scale legend (values not reliably legible from the scan).] Figure 88. Tic Tac Mach Number at 1/6 Scale, Air Temperature 223K and 1300 mph with Supersonic Inlet and Supersonic Outlet Summai) Report on BJ\J\SS l AP Analysis Capabilities Page 127 November 23. 20 I 0 [PAGE 129] ATTACHMENT Ill - RIGHT CIRCULAR CYLINDER CFO CONTOUR PLOTS FOR PRESSURE, TEMPERATURE A D MACH UMBER [Diagram: CFD color contour plot of simulated pressure (Pa) around the right circular cylinder craft model, with a numeric color-scale legend (values not reliably legible from the scan).] Figure 89. Cylinder Pressure at 1/6 Scale, Air Temperature 223K and 100 mph with Subsonic Inlet and Subsonic Outlet [Diagram: CFD color contour plot of simulated temperature (K) around the right circular cylinder craft model, with a numeric color-scale legend (values not reliably legible from the scan).] Figure 90. Cylinder Temperature at 1/6 Scale, Air Temperature 223K and 100 mph with Subsonic Inlet and Subsonic Outlet Summary Report on BAASS UAP Anal) si<; Capabilities Page 128 November 23. 2010 [PAGE 130] [Diagram: CFD color contour plot of simulated Mach number (dimensionless) around the right circular cylinder craft model, with a numeric color-scale legend (values not reliably legible from the scan).] Figure 91. Cylinder Mach Number at 1/6 Scale, Air Temperature 223K and 100 mph with Subsonic Inlet and Subsonic Outlet [Diagram: CFD color contour plot of simulated pressure (Pa) around the right circular cylinder craft model, with a numeric color-scale legend (values not reliably legible from the scan).] Figure 92. Cylinder Pressure at 1/6 Scale, Air Temperature 223K and 200 mph with Subsonic Inlet and Subsonic Outlet Summary Report on BAAS~ l AP Analysis Capabilities Page 129 November 21,2010 [PAGE 131] Figure 93. Cylinder Temperature at 1/6 Scale, Air Temperature 223K and 200 mph with Subsonic Inlet and Subsonic Outlet Figure 94. Cylinder Mach Number at 1/6 Scale, Air Temperature 223K and 200 mph with Subsonic Inlet and Subsonic Outlet Summary Report on HAASS llAP Analysis Capabilities Page 130 November 23. 20 10 [PAGE 132] [Diagram: CFD color contour plot of simulated pressure (Pa) around the right circular cylinder craft model, with a numeric color-scale legend (values not reliably legible from the scan).] Figure 95. Cylinder Pressure at 1/6 Scale, Air Temperature 223K and 300 mph with Subsonic Inlet and Subsonic Outlet [Diagram: CFD color contour plot of simulated temperature (K) around the right circular cylinder craft model, with a numeric color-scale legend (values not reliably legible from the scan).] Figure 96. Cylinder Temperature at 1/6 Scale, Air Temperature 223K and 300 mph with Subsonic Inlet and Subsonic Outlet Summary Rcrort on BA/\SS lJAP /\nal)sis Cupahilities Page 131 November 23. 20 I 0 [PAGE 133] [Diagram: CFD color contour plot of simulated Mach number (dimensionless) around the right circular cylinder craft model, with a numeric color-scale legend (values not reliably legible from the scan).] Figure 97. Cylinder Mach Number at 1/6 Scale, Air Temperature 223K and 300 mph with Subsonic Inlet and Subsonic Outlet Figure 98 Cylinder Pressure at 1/6 Scale, Air Temperature 223K and 400 mph with Subsonic inlet and Subsonic Outlet Summary Report on BAAS<; l IAP Analysi<; Capahilities Page f '.Q November 23. 2010 [PAGE 134] Figure 99. Cylinder Temperature at 1/6 Scale, Air Temperature 223K and 400 mph with Subsonic Inlet and Subsonic Outlet Figure 100. Cylinder Mach Number at 1/6 Scale, Air Temperature 223K and 400 mph with Subsonic Inlet and Subsonic Outlet Summary Report on BJ\J\SS lJAP J\nalysi<; Capabilities Page 111 November 23. 20 I 0 [PAGE 135] [Diagram: CFD color contour plot of simulated pressure (Pa) around the right circular cylinder craft model, with a numeric color-scale legend (values not reliably legible from the scan).] Figure 101. Cylinder Pressure at 1/6 Scale, Air Temperature 223K and 500 mph with Mixed Inlet and Subsonic Outlet [Diagram: CFD color contour plot of simulated temperature (K) around the right circular cylinder craft model, with a numeric color-scale legend (values not reliably legible from the scan).] Figure 102. Cylinder Temperature at 1/6 Scale, Air Temperature 223K and 500 mph with Mixed Inlet and Subsonic Outlet Summary Report on BAI\~S ll/\P Analysis C apabilitics Page 13-1 November 23. :?010 [PAGE 136] [Diagram: CFD color contour plot of simulated Mach number (dimensionless) around the right circular cylinder craft model, with a numeric color-scale legend (values not reliably legible from the scan).] Figure 103. Cylinder Mach Number at 1/6 Scale, Air Temperature 223K and 500 mph with Mixed Inlet and Subsonic Outlet [Diagram: CFD color contour plot of simulated pressure (Pa) around the right circular cylinder craft model, with a numeric color-scale legend (values not reliably legible from the scan).] Figure 104. Cylinder Pressure at 1/6 Scale, Air Temperature 223K and 700 mph with Mixed Inlet and Supersonic Outlet Summary Report on BAAS<:; l AP /\nal)si-; Capabilities Page 115 November 23. 2010 [PAGE 137] [Diagram: CFD color contour plot of simulated pressure (Pa) around the right circular cylinder craft model, with a numeric color-scale legend (values not reliably legible from the scan).] Figure 105. Cylinder Pressure at 1/6 Scale, Air Temperature 223K and 900 mph with Supersonic Inlet and Supersonic Outlet [Diagram: CFD color contour plot of simulated temperature (K) around the right circular cylinder craft model, with a numeric color-scale legend (values not reliably legible from the scan).] Figure 106. Cylinder Temperature at 1/6 Scale, Air Temperature 223K and 900 mph with Supersonic Inlet and Supersonic Outlet Summat) Report on BAA~~ l J\P Anal)sis Capabilities Page 116 November 23. 2010 [PAGE 138] [Diagram: CFD color contour plot of simulated Mach number (dimensionless) around the right circular cylinder craft model, with a numeric color-scale legend (values not reliably legible from the scan).] Figure 107. Cylinder Mach Number at 1/6 Scale, Air Temperature 223K and 900 mph with Supersonic Inlet and Supersonic Outlet [Diagram: CFD color contour plot of simulated pressure (Pa) around the right circular cylinder craft model, with a numeric color-scale legend (values not reliably legible from the scan).] Figure 108. Cylinder Pressure at 1/6 Scale, Air Temperature 223K and 1100 mph with Supersonic Inlet and Supersonic Outlet Summar) Report on BAASS UAP /\nulysis Cup.ibilitics Page 117 November 23. 201 0 [PAGE 139] [Diagram: CFD color contour plot of simulated temperature (K) around the right circular cylinder craft model, with a numeric color-scale legend (values not reliably legible from the scan).] Figure 109. Cylinder Temperature at 1/6 Scale, Air Temperature 223K and 1100 mph with Supersonic Inlet and Supersonic Outlet [Diagram: CFD color contour plot of simulated Mach number (dimensionless) around the right circular cylinder craft model, with a numeric color-scale legend (values not reliably legible from the scan).] Figure 110. Cylinder Mach Number at 1/6 Scale, Air Temperature 223K and 1100 mph with Supersonic Inlet and Supersonic Outlet Summary Report on BA/\SS lJAP Analysi<; Capabilities Page 118 Nuvcmhcr23. 20 10 [PAGE 140] [Diagram: CFD color contour plot of simulated pressure (Pa) around the right circular cylinder craft model, with a numeric color-scale legend (values not reliably legible from the scan).] Figure 111. Cylinder Pressure at 1/6 Scale, Air Temperature 223K and 1300 mph with Supersonic Inlet and Supersonic Outlet [Diagram: CFD color contour plot of simulated temperature (K) around the right circular cylinder craft model, with a numeric color-scale legend (values not reliably legible from the scan).] Figure 112. Cylinder Temperature at 1/6 Scale, Air Temperature 223K and 1300 mph with Supersonic Inlet and Supersonic Outlet Summary Report on HAASS \!AP Anal)si, Capabilities Page 139 November 23. 2010 [PAGE 141] [Diagram: CFD color contour plot of simulated Mach number (dimensionless) around the right circular cylinder craft model, with a numeric color-scale legend (values not reliably legible from the scan).] Figure 113. Cylinder Mach Number at 1/6 Scale, Air Temperature 223K and 1300 mph with Supersonic Inlet and Supersonic Outlet Summary Report on B/\/\SS ll/\P Analysis Capabilities Page 140 November 23. 2010
Mit KI aus der Originaldatei erstellt — kann Fehler enthalten.
Automatische Übersetzung — das Originaldokument ist auf Englisch. Auf Englisch ansehen →
Quelle: US-Kriegsministerium / AARO — gemeinfrei · war.gov/ufo
Entitäten in diesem Dokument
Verbundene Fälle

DOW-UAP-D168, BAASS Project Management Plan, December 2008

DOW-UAP-D169, BAASS Monthly Report, March 2009

DOW-UAP-D111, AAWSAP Solicitation and Original Order, September 2008

DOW-UAP-D112, AAWSAP Contract Modification P00001, September 2009

DOW-UAP-D113, AAWSAP Contract Modification P00002, February 2010

DOW-UAP-D114, AAWSAP Contract Modification P00003, May 2010
Verwandte Fälle

DOW-UAP-D166, Für BAASS erstellte MUFON-Berichte, November 2008

DOW-UAP-D170, Monatsbericht von BAASS, April 2009

DOW-UAP-D171, Monatsbericht von BAASS, Juni 2009

DOW-UAP-D173, Monatsbericht von BAASS, November 2009
Gleicher Ort
DOW-UAP-D166, Für BAASS erstellte MUFON-Berichte, November 2008
DOW-UAP-D168, Projektmanagementplan von BAASS, Dezember 2008

DOW-UAP-D117, AAWSAP DIRD, Metallische Gläser für Luft- und Raumfahrtanwendungen, Dezember 2009

DOW-UAP-D118, AAWSAP DIRD, Luft- und Raumfahrtanwendungen programmierbarer Materie, Dezember 2009
DOW-UAP-D169, Monatsbericht von BAASS, März 2009
DOW-UAP-D170, Monatsbericht von BAASS, April 2009
Gleiche Aktenserie
DOW-UAP-D003, Einsatzbericht, Arabischer Golf, 2020

DOW-UAP-D004, Einsatzbericht, Arabischer Golf, 2020

DOW-UAP-D005, Einsatzbericht, Arabischer Golf, 2020

DOW-UAP-D006, Einsatzbericht, Arabischer Golf, 2020

DOW-UAP-D007, Einsatzbericht, Arabischer Golf, 2020

DOW-UAP-D008, Einsatzbericht, Dschibuti, 2025
Gleicher Zeitraum
DOW-UAP-D113, AAWSAP-Vertragsänderung P00002, Februar 2010
DOW-UAP-D114, AAWSAP-Vertragsänderung P00003, Mai 2010

DOW-UAP-D115, AAWSAP-Vertragsänderung P00004, Mai 2010

DOW-UAP-D116, AAWSAP-Vertragsänderung P00005, September 2010

DOW-UAP-D119, AAWSAP DIRD, Biomaterialien, Januar 2010

DOW-UAP-D120, AAWSAP DIRD, Materialien für fortschrittliche Luft- und Raumfahrtplattformen, Januar 2010
Gleiche Veröffentlichung

DOW-UAP-D181, Ungelöster UAP-Bericht, Catalina Island, 1949

DOW-UAP-D157, Air Intelligence Information Report, Italien, 1952

DOW-UAP-D179, Air Intelligence Information Report, Catalina Island, 1952

DOW-UAP-D158, Bericht über ein Flugobjekt, Kanada, 1953

DOW-UAP-D159, Air Intelligence Information Report, Deutschland, 1953

DOW-UAP-D160, Air Intelligence Information Report, Marokko, 1953
Gleiche Behörde
331_120752_Numeric_Files_1944–1945_37153_German_Armament_Equipment_Documents
18_100754_ General 1946-7_Vol_2
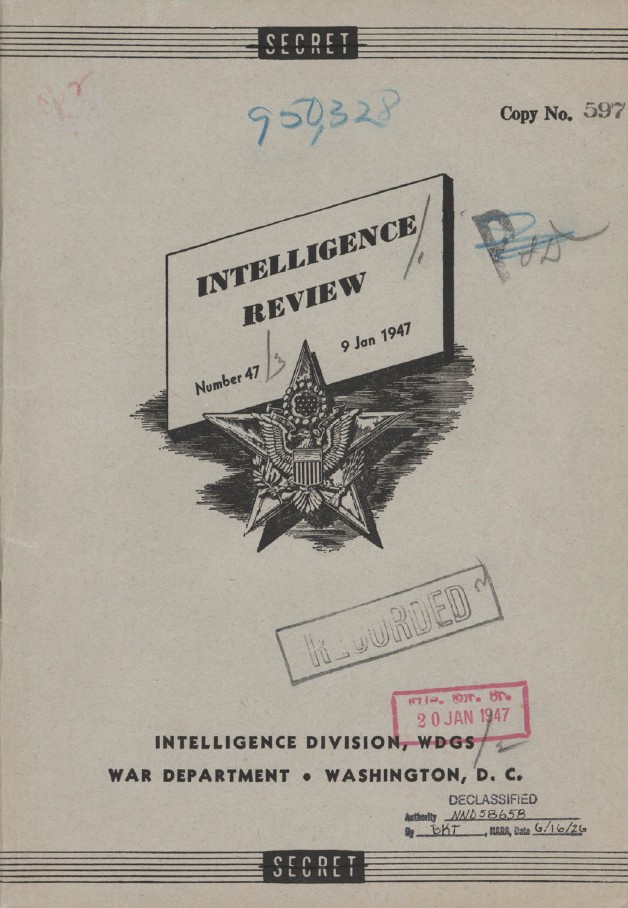
DOW-UAP-D099, Nachrichtendienstliche Auswertung der „Geisterraketen“-Vorfälle, 1947
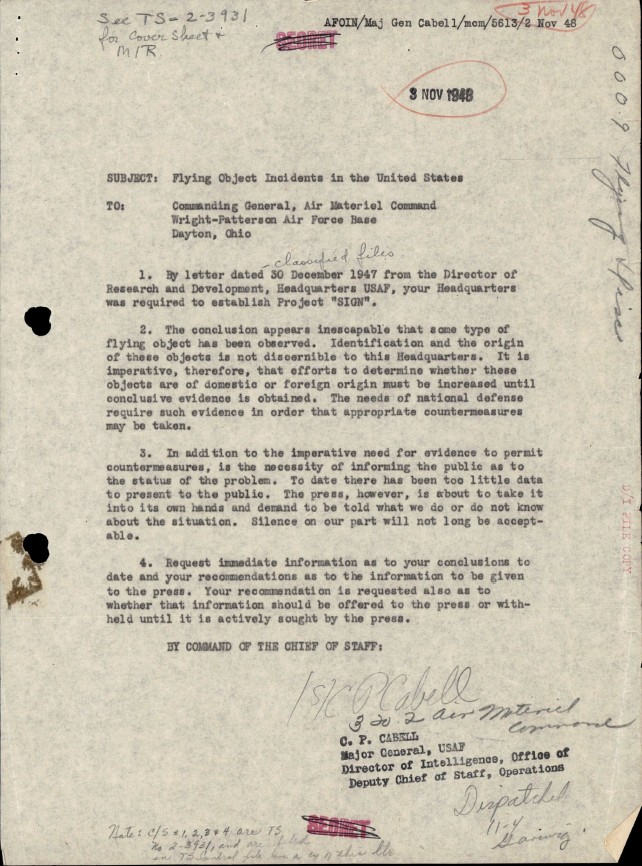
DOW-UAP-D100, Bericht des Air Materiel Command über unidentifizierte Flugobjekte, 1947-1948
18_6369445_General_1948_Vol_1