DOW-UAP-D048, Bericht des Department of the Air Force, 1996
Kerndaten
- Offizielle Akten-ID
- DOW-UAP-D48 (hier zitiert als DOW-UAP-D048)
- Dokumenttyp
- Dokument
- Behörde
- Department of War
- Veröffentlicht in
- R01 · 2026-05-08
- Datum des Vorfalls
- 9/10/96
- Ort des Vorfalls
- N/A
- Lesbare Seiten
- 181/181
- VIRIN
- 260508-D-D0360-1033
Offizielle Beschreibung
Dieser Bericht beschreibt die Modellierung unwahrscheinlicher Ausfälle von Raumfahrt-Trägerraketen in Risikoberechnungen (Modeling of Unlikely Space-Booster Failures in Risk Calculations), dokumentiert historische Ausfallmuster bei Starts und empfiehlt Korrekturmaßnahmen unter Einsatz neuartiger Modellierungstechniken.
✦ KI-Zusammenfassung
Dieses Dokument ist KEIN UAP-Begegnungsbericht. Es handelt sich um "Modeling Unlikely Space-Booster Failures in Risk Calculations" (RTI-Bericht Nr. RTI/5180/77-43F), eine 181-seitige technische Studie vom 10. September 1996, erstellt vom Research Triangle Institute (Autoren James A. Ward Jr. und Robert M. Montgomery) für das Sicherheitsbüro des 45th Space Wing (Patrick AFB, FL) und das Sicherheitsbüro des 30th Space Wing (Vandenberg AFB, CA) des Department of the Air Force. Der Bericht dokumentiert das DAMP-Risikoanalyseprogramm des RTI ('facility DAMage and Personnel injury'), das zur Modellierung des Risikos im Startbereich und entlang der Flugbahn durch unwahrscheinliche Ausfallmodi von Raketen-Boostern verwendet wird -- insbesondere 'Mode-5'-Ausfälle, bei denen eine fehlfunktionierende Rakete oder ein Raumfahrzeug von seiner vorgesehenen Flugbahn abweicht und dabei möglicherweise Personen oder Schiffe weit außerhalb des normalen Trümmerbereichs gefährdet. Die Studie entwickelt per Simulation Formkonstanten für eine Einschlagdichtefunktion, angepasst an empirische Ausfalldaten der Trägerraketen Atlas, Delta, Titan sowie Thor/von Thor angetriebener Fahrzeuge. Ein umfangreicher Anhang (etwa Seiten 96-170) katalogisiert eine narrative Start- und Ausfallgeschichte für jeden Atlas-, Delta-, Titan- und Thor-/Thor-angetriebenen Start von der Eastern und Western Range vom jeweiligen Programmbeginn bis August 1996 und klassifiziert jede Anomalie nach Reaktionsmodus und Flugphase. Im extrahierten Text finden sich an keiner Stelle Erwähnungen von UAP, UFOs oder anomalen Luftphänomenen (bestätigt durch Volltextsuche über alle 181 Seiten) -- dies scheint ein unabhängiges administratives/technisches Dokument zu sein, das versehentlich in das UAP-Freigabeverzeichnis von war.gov geraten ist, im Unterschied zu den UAP-Fallakten im Missionsberichtsstil derselben Charge.
Mit KI aus der Originaldatei erstellt — kann Fehler enthalten.
▸Transkript(181 von 181 Seiten lesbar)
[PAGE 1] RESEARCH TRIANGLE INSTITUTE RTI Contract No FO4703-91-C-0112 RTI Report No RTl/5180/77-43F September 10 1996 Modeling Unlikely Space-Booster Failures in Risk Calculations 19961025 122 Final Report Prepared for Department of the Air Force 45th Space Wing AFSPC Safety Office 45 SW/SE Patrick AFB FL 32925 and Department of theAir Force 30th SpaceWing AFSPC Safety Office- 30 SW/SE Vandenberg AFB CA 93437 Distribution authorized to US Government agencies and their contractors to protect administrative operational use data 10 September 96 Other requests for this document shall be referred to the 30th Space Wing AFSPC Safety Office 30 SW/SE Vandenberg AFB CA 93437 or 45th Space Wing AFSPC Safety Office 45 SW/SE Patrick AFB FL 32925 mJC QUALITY INSPECTED ff 3000 Al1antic Avenue Cocoa Beach Flo ida 329315029 US/1 [PAGE 2] Contract No FO4703-91-C-0112 RTI Report No RTI/5180/77-43F Task No 10/95-77 Subtask 2.0 September 10 1996 Modeling Unlikely Space-Booster Failures in Risk Calculations Final Report Prepared by James A Ward Jr Robert Montgomery of Research Triangle Institute Center for Aerospace Technology Launch Systems Safety Department Prepared for Department of the Air Force 45th Space Wing AFSPC Safety Office 45 SW SE Patrick AFB FL 32925 and Department of the Air Force 30th Space Wing AFSPC Safety Office 30 SW SE Vandenberg AFB CA 93437 Distribution authorized to US Government agencies and their contractors to protect administrative operational use data 10 September 96 Other requests for this document shall be referred to the 30th Space Wing AFSPC Safety Office 30 SW/SE Vandenberg AFB CA 93437 or 45th Space Wing AFSPC Safety Office 45 SW/SE Patrick AFB FL 32925 [PAGE 3] Form Approved REPORT DOCUMENTATION PAGE 0MB No 0704-0188 Public tel)Ort1ng burden for this collection of information is estimated to average hour per response induding the time for reviewing instructions searching exi5ting data sources gathering and maintain in the data needed and completing and rev,ew,ng the collection of Information Send comments r~ardlng tlils burden estimate or any other aspect of this collection of Information including suggestions tor reducing this burden tO Washington Headquarters Services Directorate or Information Operations and Reports 1215 Jefferwn Davis Highway Suite 1204 Arlington VA 12202-4302 and to the Office of Management and Budget Paperwork Reduction Project(0704-0188 Washington DC 20503 AGENCY USE ONLY Leave blank REPORT DATE REPORT TYPE AND DATES COVERED eptember 10 1996 Final TITLE AND SUBTITLE FUNDING NUMBERS f.1odeling Unlikely Space-Booster Failures in Risk Galculations F04703-91-C-o112 TA:10/95-TT AUTHORW James A ard Jr Robert Montgomery PERFORMING ORGANIZATION NAME(S AND ADDRESS(ES PERFORMING ORGANIZATION REPORT NUMBER Research Triangle Institute ACTA Inc RTl/5180m-43F 3000 Atlantic Avenue Skypark3 11 Cocoa Beach FL 32931 23430 Hawthorne Blvd Suite 300 Torrance CA 90505 SPONSORING/MONITORING AGENCY NAME(S AND ADDRESS(ES SPONSORING MONITORING AGENCY REPORT NUMBER Department of the Air Force AFSPC Department of the Air Force AFSPC 30th Space Wing 45th Space Wing r\~'1~.1 -m.-t1<a-a Vandenberg AFB CA 93437 Patrick AFB FL 32925 -Mr Martin Kinna 30 SW/SEY Louis Ullian Jr 45 SW/SED 11 SUPPLEMENTARY NOTES Subcontractor Prime Contractor 12a DISTRIBUTION/AVAILABILITY STATEMENT 12b DISTRIBUTION CODE Distribution authorized to US Government agencies and their contractors to protect administrative/operational use data 10 September 96 Other requests for this document shall be referred to the 30th Space Wing AFSPC Safety Office 30 SW/SE),Vandenberg AFB CA 93437 or 45th Space Wing AFSPC Safety Office 45 SW/SE Patrick AFB FL 32925 13 ABSTRACT Maximum 200 words Missile and space-vehicle performance histories contain many examples of failures that cause or have the potential to cause significant vehicle deviations from the intended flight line In RTl's risk-analysis program DAMP such failures are referred to as Mode-5 failure responses Although Mode--5 failure responses are much less likely to occur than those that result in impacts near the flight line risk-analysis studies are incomplete without them This report shows how Impacts from Mode-6 failures are modeled in program DAMP The impact density function used for this purpose contains two shaping constants that control the rate at which the density function drops In value as the angular deviation from the flight line and the impact range increase Certain Mode--5 malfunctions are simulated and the two shaping constants then chosen by trial and error so that impacts from the simulated malfunctions and the theoretical density function are in close agreement An appendix to the report contains a listing and brief narrative failure history of the A~as Delta and Titan missile and space-vehicle launches from the Eastern and Western Ranges from the beginning of each program through August 1996 Each entry gives the vehicle configuration whether the flight was a success the flight phase in which any anomalous behavior occurred and a classification of vehicl behavior in accordance with defined failure-response modes 14 SUBJECT TERMS 15 NUMBER OF PAGES launch risk unlikely failure modeling booster failure probabilities 180 16 PRICE CODE 17 SECURITY CLASSIFICATION 18 SECURITY CLASSIFICATION 19 SECURITY CLASSIFICATION 20 LIMITATION OF ABSTRACT OF REPORT OF THIS PAGE OF ABSTRACT Unclassified lJnclassified lnclasslfled SAR NSN 7540-01-280-5500 Standard Form 298 Rev 2-89 Prescribed by AIIISI Std Z39-18 298·102 [PAGE 4] Abstract Missile and space-vehicle performance histories contain many examples of failures that cause or have the potential to cause significant vehicle deviations from the intended flight line In RTI risk-analysis program DAMP such failures are referred to as Mode-5 failure responses Although Mode-5 failure responses are much less likely to occur than those that result in impacts near the flight line risk-analysis studies are i ncomplete without them This report shows how impacts from Mode-5 failures are modeled in program DAMP The impact density function used for this purpose contains two shaping constants that control the rate at which the density function drops in value as the angular deviation from the flight line and the impact range increase Certain Mode-5 malfunctions are simulated and the two shaping constants then chosen by trial and error so that impacts from the simulated malfunctions and the theoretical density function are in close agreement An appendix to the report contains a listing and brief narrative failure history of the Atlas Delta and Titan missile and space-vehicle launches from the Eastern and Western Ranges from the beginning of each program through August 1996 Each entry gives the vehicle configuration whether the flight was a success the flight phase in which any anomalous behavior occurred and a classification of vehicle behavior in accordance with defined failure-response modes Various filtering or data weighting techniques are described The empirical data are then filtered to estimate failure probabilities for Atlas Delta and Titan and percentages of future failures that will result in Mode-5 and other Mode responses 9/10/96 RTI [PAGE 5] Table of Contents Introduction Examples Showing Need for Mode Understanding the Mode-5 Failure Response 3.1 Effects of Mode-5 Shaping Consta.nts 3.2 Effects of Shaping Constant on DAMP Results Methodology for Assessing Failure Probabilities 13 4.1 The Parts-Analysis Approach 13 4.2 The Empirical Approach 15 Computation of Failure Probabilities 16 5.1 Overall Failure Probability 16 5.2 Relative and Absolute Probabilities for Response Modes 24 5.3 Relative Probability of Tumble for Response-Modes and 30 Shaping Constants Through Simulation 31 6.1 Malfunction Tum Simulations 31 6.1.1 Random-Attitu.de Failures 31 6.1.2 Slow-Tum Failures 32 6.1.3 Factors Affecting Malfunction-Tum Results 33 6.1.4 Malfunction-Tum Results for Atlas IIAS 35 6.2 Shaping Constants for Atlas IIAS 37 6.2.1 Optimum Mode-5 Shaping Constants 37 6.2.2 Launch-Area Mode-5 Risks 49 6.2.3 Effects of Mode-5 Constants on Ship-Hit Contours 51 6.2.4 Range Distributions of Theoretical and Simulated Impacts 58 6.3 Shaping Constants for Delta-GEM 60 6.3.1 Optimum Mode-5 Shaping Constants 61 6.3.2 Launch-Area Mode-5 Risks 64 6.4 Shaping Constants for Titan IV 65 6.5 Shaping Constants for LL Vl 69 6.6 Shaping Constants for Other Launch Vehicles 72 Potential Future Investigations 73 Summarv 74 9/10/96 ii RTI I [PAGE 6] Appendix A Failure Response Modes in Program DAMP 79 Appendix Shaping-Constant Effects on Mode-5 Impact Distributions 81 Appendix Filter Characteristics 90 Appendix Launch and Performance Histories 96 Basic Data 96 D.1.1 Data Sources 96 D.1.2 Assignment of Failure-Response Modes 98 D.1.3 Assignment of Flight Phase 98 D.1.4 Representative Configurations 100 Atlas Launch and Performance History 101 D.2.1 A'tlas Launch History 103 D.2.2 Atlas Failure Narratives 115 Delta Launch and Performance History 133 D.3.1 Delta Launch History 136 D.3.2 Delta Failure Narratives 142 Titan Launch and Performance History 146 D.4.1 Titan Launch History 149 D.4.2 Titan Failure Narratives 157 Thor Launch and Performance History Not Including Delta 164 D.5.1 Thor and Thor-Boosted Launch History 164 D.5.2 Thor and Thor-Boosted Failure Narratives 167 References 171 9/10/96 iii RTI [PAGE 7] Table of Figures Figure Joust Impact Trace Showing a Mode-5 Failure Response Figure Atlas IIAS Risk Contours for Inner-Ear Injury with A 3.0 11 Figure Atlas IIAS Risk Contours for Inner-Ear Injury with A 3.5 12 Figure Filter Factor Results for Representative Configurations of Atlas 23 Figure Combined Random-Attitude and Slow-Tum Results 36 Figure Atlas IIAS Breakup Percentages for Random-Attitude Tums 37 Figure Atlas HAS Impacts with No Breakup 39 Figure Atlas IIAS Impacts with Breakup 40 Figure Atlas IIAS Simulation Results with 1,000 42 Figure 10 Atlas IIAS Simulation Results with 50,000 44 Figure 11 Atlas HAS Simulation Results with 100,000 45 Figure 12 Atlas HAS Simulation Results with 500,000 46 Figure 13 Atlas HAS Simulation·Results with 5,000,000 47 Figure 14 Effects of Breakup q-alpha on A for Atlas IIAS 49 Figure 15 Mode-5 Density-Function Values at Three Miles 51 Figure 16 Atlas IIAS Mode-5 Ship-Hit Contours with A 3.00 53 Figure 17 Atlas IIAS All-Mode Ship-Hit Contours with A 3.00 54 Figure 18 Atlas IIAS Mode-5 Ship-Hit Contours with A 3.45 55 Figure 19 Atlas IIAS All-Mode Ship-Hit Contours with A 3.45 56 Figure 20 Atlas IIAS Mode-5 Ship-Hit Contours with A 6.30 57 Figure 21 Atlas IIAS All-Mode Ship-Hit Contours with A 6.30 58 Figure 22 Impact-Range Distributions 59 Figure 23 Delta-GEM Breakup Percentages 61 Figure 24 Delta-GEM Simulation Results with -1,000 62 Figure 25 Delta-GEM Simulation Results with Best-Fit Shaping Constants 63 Figure 26 Titctn IV Breakup Percentages 65 Figure 27 Titan·Simulation Results with 1,000 66 Figure 28 Titan Simulation Results with Best-Fit Shaping Constants 67 Figure 29 LLVl Breakup Percentages 69 Figure 30 LL Vl Simulation Results with l,000 70 iv RTI 9/10/96 [PAGE 8] Figure 31 LL Vl Simulation Results with Best-Fit Shaping Constants 71 Figure 32 £-Ratios for Ranges from to 25 Miles 86 Figure 33 Percentage of Impacts Between Flight Line and Any Radial 87 Figure 34 Percentage of Impacts in 5-Degree Sectors 88 Figure 35 Exponential Weights for Fading-Memory Filters 93 Figure 36 Recursive Filter Factor for Last Data Point 94 Figure 37 Atlas Launch Summary 102 Figure 38 Delta Launch Summary 135 Figure 39 Titan Launch Summary 148 Figure 40 Thor Launch Summary 164 Table of Tables Table Effects of Mode-5 Shaping Constant A on Atlas IIA Risks 10 Table Predicted Failure Probabilities for Representative Configurations 17 Table Predicted Failure Probabilities for All Configurations 18 Table Comparison of Weighting Percentages 19 Table Filter Factor Influence on Weighting Percentages 21 Table Failure Probabilities for Atlas Delta and Titan 24 Table Number of Atlas Failures All Configurations 532 Flights 25 Table Number of Delta Failures-All Configurations 232 Flights 25 Table Number of Titan Failures All Configurations 337 Flights 25 Table 10 Number of Eastern-Range Thor Failures 85 Flights 25 Table 11 Number of Failures for All Vehicles 1186 Flights 26 Table 12 Date of Most Recent Failure 26 Table 13 Percentage Weighting for Sample of 1186 Launches 27 Table 14 Response-Mode Occurrence Percentages 27 Table 15 Recommended Response-Mode Percentages for Flight Phases 28 Table 16 Recommended Response-Mode Percentages for Flight Phases 29 Table 17 Absolute Failure Probabilities for Response Modes 29 Table 18 Percent of Response Modes and That Tumble 30 9/10/96 [PAGE 9] Table 19 Sample Impact Distribution for Atlas IIAS- with No Breakup 41 Table 20 Shaping Constants for Atlas IIAS 48 Table 21 Shaping Constants and Related Risks for Atlas HAS 50 Table 22 Best-Fit Conditions for Atlas IIAS 52 Table 23 Shaping Constants and Related Risks for Delta-GEM 64 Table 24 Shaping Consta.nts for Titan IV 68 Table 25 Shaping Constants for LLVl 72 Table 26 Summary of A Values for 1,000 72 Table 27 Failure Probabilities for Atlas Delta and Titan 75 Table 28 Recommended Response-Mode Percentages for Flight Phases 75 Table 29 Recommended Response-Mode Percentages for Flight Phases 75 Table 30 Absolute Failure Probabilities for Response Modes 76 Table 31 Summary of A Values for 1,000 77 Table 32 Summary of Optimum·Mode-5 Shaping Constants 77 Table 33 Effect on £-Ratio-of Varying Mode-5 Constant A 1000 Part 82 Table 34 Effect on £-Ratio-of Varying Mode-5 Constant A 1000 Part 83 Table 35 Effect on £-Ratio-of Varying Mode-5 Constant A Part 84 Table 36 Effect on £-Ratio-of Varying Mode-5 Constant A Part 85 Table 37 Filter Application for Failure Probability 95 Table 38 Flight-Phase Defi°:,itions 99 Table 39 Flight Phases by Launch Vehicle 99 Table 40 Summary of Atlas Vehicle Configurations 101 Table 41 Atlas Launch History 103 Table 42 Summary of Delta Vehicle Configurations 133 Table 43 Delta Launch History 136 Table 44 Summary of Titan Vehicle Configurations 147 Table 45 Titan Launch History 149 Table 46 Thor Launch History 165 Vl RTI 9/10/96 [PAGE 10] Introduction The debris from most launch vehicles that fail catastrophically tend to impact close to the intended flight line Typical failures that produce such results are premature thrust termination stage ignition failure tank rupture or explosion or rapid out-of-control tumble Less likely malfunctions may cause a vehicle to execute a sustained turn away from the flight line Examples are control failures that cause the rocket engine to lock in a fixed position near null or failures leading to erroneous orientation of the guidance platform Such failures should not be ignored since they may produce nearly all or a significant part of the risks to population centers that are more than a mile or so uprange or many miles away from the flight line Consequently RTI has been tasked to estimate the probabilities of occurrence of these less-likely failures and to determine optimum values for the shaping constants of the associated impact-density function RTI has developed a prototype risk-analysis program to analyze the level of risk in the launch area when ballistic missiles and space vehicles are launched and to provide guidelines for launch operations and launch-area risk management This program facility DAMage and Personnel injury DAMP uses information about the launch vehicle its trajectory and failure responses and facilities and populations in the launch area to estimate hit probabilities and casualty expectations When a missile or space vehicle malfunctions people and facilities may be subjected to significant risks from falling inert debris or from overpressures and secondary debris produced by a stage component or large propellant chunk that explodes on impact Although fire toxic materials and radiation may also subject personnel to significant danger these hazards are not addressed in program DAMP Hazards are greatest in the launch area and along the intended flight line but lesser hazards exist throughout the area inside the impact limit lines Small hazards exist even outside these lines if the flight termination system fails or other unlikely events occur In computing launch-area risks DAMP makes no attempt to model vehicle failures per se A list of possible failures for any vehicle would be extensive and variations in failures from vehicle to vehicle would complicate the modeling process Instead DAMP models failure responses Regardless of the exact nature of the failures that can occur there are only six possible response modes that affect risks on the ground five for failure responses and one to model the behavior of a normal vehicle The six modes are described in Appendix A It can be seen from the descriptions that impacts resulting from failure-response Modes and occur at most a mile or two from the launch point while those from Mode can only occur near the flight line even though the vehicle may tumble before breakup or destruct Although the hazards outside the launch area and away from the flight line may be small vehicle flight tests through the years have demonstrated that finite hazards do exist in these areas Such hazards are due almost entirely to Mode-5 failure responses even through the probability of a Mode-5 failure may be only a small part of the total failure probability The Mode-5 failure-response theoretical though it is was developed to reflect the facts that unlikely vehicle failures 9/10/96 RTI [PAGE 11] can cause impacts uprange or well away from the intended flight line and some vehicle failures cannot logically be classified as Response Modes or In- keeping with the above the Mode-5 impact-density function was developed with the characteristics listed below The function which fills the void left by Modes through is sufficiently robust to include all possible impacts yet seemingly comports with observed test results Impacts can occur in any direction from the launch point and at any range within the vehicle's energy capabilities At any given impact range from the launch point the likelihood of impact decreases as the angular deviation from the flight line increases becoming least likely in the uprange direction For any fixed angular deviation from the flight line the likelihood of impact decreases as the impact range increases At fixed impact ranges near the launch point the impact density function changes gradually as the impact direction swings 180° from downrange to uprange As the impact range increases the decrease in the density function becomes progressively more and more rapid with change in impact direction In other words the greater the impact range the more rapidly the density function changes with angular deviation from the flight line As modeled in DAMP the effects of destruct action on the Mode-5 density function are accounted for in the launch area by supplementing impacts inside the impact limit lines with those that would occur outside the impact limit lines if no destruct action were taken The Mode-5 failure-response methodology was fully developed in an earlier RTI report11 As pointed out there the shape of the impact density function can be controlled somewhat through the selection of shaping constants that appear in the defining equation Intuition suggests that the constants should be vehicle dependent since ruggedly built missiles would after a malfunction be more likely to impact well away from the flight line than would a fragile space vehicle that tends to break up before deviating significantly and certain vehicles after a malfunction tend to stabilize and continue thrusting at large angles of attack while other vehicles that experience similar malfunctions tend to tumble Hit probabilities computed by-program DAMP for targets located more than two miles or so uprange from the pad or more than a few miles from the flight line are due almost entirely to the Mode-5 impact-density function Thus the assumed probability of occurrence of a Mode-5 response as well as the selected Mode-5 constants are of considerable importance The tasking for this study is set forth as Task No 10/95-77 Paragraph 2.0 of Contract FO4703-91-C-0112 The primary purpose of the tasking is Perform a study to determine the best values for Mode-5 failure probability and the Mode-5 density- function shaping constant A Although not explicitly included in the statement of work the study also develops absolute failure probabilities for Atlas Delta and Titan and 9/10/% RTI [PAGE 12] relative probabilities of occurrence for all failure-response modes for these vehicles LL Vl and other new launch systems Although it may be reasonable to establish the relative probability of occurrence of a Mode-5 failure response by empirical means the number of Mode-5 failures is too small to have any hope of establishing accurate values for the shaping constants from this sample alone Inadequate descriptions of vehicle behavior in the available historical records and uncertainty in impact location following a malfunction add to the difficulty of classifying failure responses In view of the limited data available for vehicles that have experienced Mode-5 failures the values chosen for the Mode-5 constants must depend on simulations of vehicle behavior following failure Examples Showing Need for Mode The need for a Mode-5 response or some similar response mode or a multiplicity of other response modes can be seen from the following vehicle performance descriptions extracted from Appendix Atlas BE 24 Jan 61 Missile stability was lost at about 161 seconds some 30 seconds after BECO probably due to failure of the servo-amplifier power supply The sustainer engine shut down at 248 seconds and the vernier engines about 10 seconds later Impact occurred 1316 miles downrange and 215 miles crossrange Titan Oct 61 A one-bit error in the velocity accumulation caused impact 86 miles short and 14 miles right of target Atlas 145D Mariner 22 July 62 Booster stage and flight appeared normal until after booster staging at guidance enable at about 157 seconds Operation of guidance rate beacon was intermittent Due to this and faulty guidance equations erroneous guidance commands were given based on invalid rate data Vehicle deviations became evident at 172 seconds and continued throughout flight with a maximum yaw deviation of 60° and pitch deviation of 28° occurring at 270 seconds The vehicle deviated grossly from the planned trajectory in azimuth and velocity and executed abnormal maneuvers in pitch and yaw The missile was destroyed by the RSO at 293.5 seconds some 12 seconds after SECO Atlas SLV-3 GTA-9 17 May 66 Vehicle became unstable when pitch control was lost at 121 seconds Loss of pitch control resulted in a pitch-down maneuver much greater than 90° Guidance control was lost at 132 seconds After BECO the vehicle stabilized in an abnormal attitude Although the vehicle did not follow the planned trajectory SECO at 280 seconds VECO at 298 seconds and Agena separation occurred normally from programmer commands Atlas 95F ABRES AFSC May 68 Immediately after liftoff the telemetered roll and yaw rates indicated that the missile was erratic During the first 10 seconds of flight the missile yawed hard to the left It then began a hard yaw to the right 9/10/96 RTI [PAGE 13] crossed over the flight line and continued toward the right destruct line Shortly thereafter the missile apparently pitched up violently and the HP began moving back toward the beach The missile was destructed at about 45 seconds when the altitude was about 14,000 feet and the downrange distance about miles Major pieces impacted less than a mile offshore indicating uprange movement of the impact point during the last part of thrusting flight Delta Intelsat III 18 Sep·68 Due to loss of rate gyro undamped pitch oscillations began at 20 seconds A series of violent maneuvers followed at 59 seconds During the 13-second period while these maneuvers continued the vehicle pitched down some 270° then up 210° and then made a large yaw to the left At 72 seconds the vehicle regained control and flew stably in a down and leftward direction until 100 seconds At this time with the main engine against the pitch and yaw stops the destabilizing aerodynamic forces became so large that quasi- control could no longer be maintained The first stage broke up at 103 seconds The second stage was destroyed by the RSO at 110.6 seconds Major pieces impacted about 12 miles downrange and miles left of the flight line Delta Pioneer 27 Aug 69 First-stage hydraulics system failed a few seconds before first-~tage burnout MECO The vehicle pitched down yawed left rolled counterclockwise driving all gyros off limits and then tumbled Second-stage separation and ignition occurred while the vehicle was out of control After about 20 seconds the second stage regained control in a yaw-right pitch-up attitude It flew stably in this attitude for about 240 seconds until destroyed by the safety officer at +484 seconds Atlas 68E Dec 80 Flight appeared normal until 102.7 seconds when the lube oil pressure on the booster engine suddenly dropped At 120.1 seconds the engine shut down followed 385 msec later by guidance shutdown of the Bl engine The asymmetric thrust during shutdown caused yaw and roll rates that the flight-control system could not correct As a result attitude control was lost and the thrusting sustainer pivoted the missile to a retrofire attitude before the vehicle could be stabilized After the booster package was jettisoned the missile was stabilized and decelerating in the retrofire mode by 148 seconds The sustainer continued thrusting in this attitude until 282.9 seconds when reentry heating apparently caused sustainer shutdown and vehicle.breakup 9/10/96 RTI [PAGE 14] It is obvious from the response-mode definitions in Appendix A that none of the described vehicle failures can be considered as a Mode or response or a Mode-4 on-trajectory failure Except possibly for it also seems apparent that none can be modeled as either a rapid tumble or a slow tum Although prompt destruct action during any of the described flights might have resulted in a Mode-4 classification the safety officer typically needs several seconds to evaluate data after a malfunction Quick action is contrary to safety philosophy if impact limit lines are not threatened and the destruct system is not at risk since additional flight time enhances the user's opportunity to pinpoint the nature of the problem 9/10/96 RTI [PAGE 15] A good illustration of a Mode-5 failure response occurred during launch of Prospector Joust on the Eastern Range in-June 1991 The Joust consists of a single-stage Castor IV-A solid-propellant rocket motor and a payload module The vehicle made a radical pitch-up maneuver due to aft-skirt structural failure at approximately 14 Seconds 121 The vacuum instantaneous impact trace from the RSO console is shown in Figure If the safety officer had taken destruct action during the time interval from 18 to 25 seconds impact would have been well away from the flight line CYIER A UNCLRSSIFIED IP AP JOUST1761-R r20SEC a PP.rttE I 17B RLTEP CNH!AVE53 SKIN ON TRRCK ON TRACK DELAY --25SEC II DELAY r1BSEC 30SEC 12 CHEV 15 CHEV 16.3 iLO 19.7 5LO II 5HT a RGT 32.2 SltT 15SEC LFT LOU LOIi 78 HDG 625 VEL ALT I CNTRAVE'i SKIN i ON TRRU ON TRACK I I DELAY I 0.5 DELAY i I i GREEN Figure Joust Impact Trace Showing a Mode-5 Failure Response As still another example of a Mode-5 failure response a guided Red Tigress sounding rocket was launched from Pad 20 at Cape Canaveral on 20 Aug 91 Within a second or two after clearing the launcher the rocket made a near 90° right tum and flew stably in this direction until destroyed by the safety officer at 23.3 seconds Pieces impacted some two or three miles from the launch pad This failure might have been classified as a Mode-2 response if destruct action had been taken·shortly after launch 9/10/96 RTI [PAGE 16] Understanding the Mode-5 Failure Response Unlike failure response Modes and response Mode and also Mode is not a direct function of time from launch For Modes and the mean point of impact MPI for each debris class is fixed once the failure time is established At each instant there is only one possible location for the MPI for each debris class On the other hand the Mod~S impact- density function for each debris class consists of a primary part and a secondary superimposed part The primary impact-density function accounts for impact variability due to the erratic flight of the vehicle It is used to determine the probability that the mean piece in a debris class resulting from vehicle breakup falls in a given area say on a building or open field The secondary density function accounts for debris dispersion due to vehicle breakup and to aerodynamic effects during free fall It is used to determine the probability that fragments from the class actually hit a building or field In other words the primary impact-density function is used to compute the probability that the secondary function is centered in some specified area the secondary function which describes the distribution of class pieces about the mean point is then used to compute the probability that one or more class pieces impacts on the specified population center or area The primary part of the Mod~S impact density function which was presented as Eq 9.5 in Ref is reproduced here as Eq where is the range from the launch point in miles is the angle in radians between the uprange direction and a line fro:r,n the pad through the impact point is the impact-range rate in miles per second A and are dimensionless shaping constants and shaping- constant is in miles For a Mod~S response there is by definition an earliest time of occurrence TP pitch-over time and a latest time of occurrence burnout orbital injection or some other specified termination time The specific time in this span at which a Mode-5 response manifests itself is of no consequence although the duration of the span must be considered in assigning a probability of occurrence for a Mod~S response Given that a Mod~S response has occurred the probability that the center of the secondary function lies in some region or on some building population center is determined by integrating the primary impact-density function for the class over the region or building The primary function depends on range and direction from the launch point to the population center but not directly on time from launch The primary function does As an aid to understanding the supplement of designated as is used in plots and tables in this report 9/10/96 RTI [PAGE 17] however involve the quantity which is expressed explicitly as a function of and only implicitly as a function·of time Values of from the nominal trajectory are differenced to computeR The secondary Mode-5 impact-density function is circular normal in form and expressed by the equation where is the distance from the impact point of the mean piece to the center of the target and oc is the standard deviation dispersion for the debris class The fact that the center of the secondary impact-density function or secondary MPI for a debris class lies Off some population center does not necessarily mean that pieces in the class hit the center The probability that one or more pieces actually hits the pop center is determined by integrating the secondaryimpact-density function over the center and combining results for all pieces in the class The dispersions for the secondary function are computed by root-sum- squaring individual dispersions arising from the effects of winds vehicle-breakup velocities and drag uncertainties for the class They are computed from the nominal trajectory and cari be explicitly expressed as a function of impact range Since the pop center can also be hit if the MPI of the secondary density function lies outside the pop center all possible mutually-exclusive locations of the secondary function that can result in impact on the pop center must be considered For each mutually-exclusive location the probability that one or more class pieces impacts on the pop center is calculated and the results combined to obtain the total hit probability for the class The Mode-5 primary impact-density function is modeled so it is independent of how the impact point arrives at a particular location For example there are myriad paths that a vehicle can travel to impact at a location two miles crossrange left from the launch pad Figure shows one such way for a Joust vehicle that failed at 15 seconds but four seconds later had moved the impact point uprange and CTO$!ange to a position two miles crossrange left from the launch point Another way to place the impact point two- miles crossrange left is for the vehicle to fly in the wrong direction north instead of east from liftoff Although numerous failure mechanisms and vehicle behaviors can lead to a Mode-5 response and impact in a particular area the exact mechanism and behavior are irrelevant All such possibilities are assumed to be accounted for by Eq Four specific failures that produce Mode-5 responses are easily- described a re-orientation of the guidance platform insertion of an erroneous spatial target into the guidance system locking of the engine nozzle in a fixed position near null thus producing a near-constant angular These dispersions are a subset of the Mode-4 impact dispersions 9/10/96 RTI [PAGE 18] acceleration of the vehicle body and a slow turn of the velocity vector erroneous accumulation of velocity bits by the guidance system Many other Mode-5 responses are so convoluted that they defy description or categorization 3.1 Effects of Mode-5 Shaping Constants The primary part of the Mode-5 impact-density function was presented previously as Eq As originally formulated the function contained three shaping constants If both numerator and denominator of the equation are divided by the constant and is substituted for one unnecessary constant disappears so that the function may be expressed as follows The values chosen for the shaping constants A and that appear in Eq influence but do not change the basic nature of the Mode-5 impact-density function For many years values of A 2.5 and 1000 were used in the Eastern Range ship-hit computations although in more recent risk studies the value of A has been increased to 3.0 This increase resulted from the observation that in recent years vehicles that experience Mode-5 failure responses seem less likely than earlier developmental vehicles to deviate significantly from the intended flight line To see how A and affect the distribution of Mode-5 impacts and to further understanding of the function the results of choosing various values of A and are provided in Appendix 3.2 Effects of Shaping Constant on DAMP Results As pointed out in the Introduction two important types of constant parameters required by DAMP for risk estimations must be determined They are probability of a Mode-5 failure response and valqes of the Mode-5 shaping constants A and currently set at 3.0 and 1000 respectively As will be demonstrated later DAMP results are far more sensitive to changes in A than in The following cases illustrate the effects that constant A has on calculated risks Case Baseline Risks for Atlas IIA In the baseline risk analysis for Atlas IIAm the probability of a Modew5 failure response was estimated at 12.5% of the total failure probability during the first 120 seconds of flight Even so risks resulting from Mode-5 responses accounted for about 90% of the total risks for people inside the impact limit lines ILL Table indicates the range of risks inside the ILLs for day launches from Pad A using various estimates of the shaping constant A and a value of 1000 9/10/96 RTI [PAGE 19] Table Effects of Mode-5 Shaping Constant A on Atlas IIA Risks 1,000 Percent of Mode-5 IPs Uprange 28.6 Casualty Expectancv 10° inside ILLs Modes Total for all Modes 246 259.9 Constant A 2.5 3.0 3.5 4.0 20.7 14.6 10.0 136 149.4 58.9 72.7 30.5 44.3 The results in·the third column are directly proportional to the probability that a Mode failure occurs For the Atlas IIA analysis a value of 1/200 0.005 was assumed Case Risk Contours for Atlas IIAS Definitions of Flight Hazard Area and Flight Caution Area may be based on the risk contours for inner-ear injury Constant A can have a significant effect on the location of the 10-6 contour as illustrated in Figure and Figure for the Atlas IIAS For these figures the Mode-5 absolute probability of occurrence was 0.005 constant A was 3.0 and 3.5 and constant was 1000 9/10/96 10 RTI [PAGE 20] lf Lo i I I I 1--1 II I 1--1 1--1wLn l/l I a a ZS I:1--1L Figure Atlas HAS Risk Contours for Inner-Ear Injury with A 3.0 9/10/96 11 RTI [PAGE 21] Figure Atlas IIAS Risk Contours for Inner-Ear Injury with A 3.5 9/10/96 12 RTI [PAGE 22] Methodology for Assessing Failure Probabilities A primary purpose of this study is to develop estimates of the relative probabilities of occurrence of a Mode-5 failure response for Atlas Delta Ti and as a by-product for other launch vehicles as well Natural fallouts of this effort are the relative probabilities of occurrence of other failure-response modes used in program PAMP as well as overall vehicle failure probabilities There are at least two approaches commonly used in estimating launch-vehicle failure probabilities a so-called parts-analysis or engineering approach involving an engineering assessment of the reliability of various parts and components comprising each missile subsystem and the effects of a part component or subsystem failure and an empirical statistical approach based on actual launch results There are serious problems with both approaches 4.1 The Parts-Analysis Approach A description of this approach its difficulties and shortcomings are discussed in some detail in a draft report by Booz Allen Hamilton Inc 141 prepared in 1992 for the Air Force Space Command Since we cannot improve on the ideas and words expressed by Booz Allen we quote the following from that report The engineering approach for calculation of launch vehicle success rates is based on measurement/estimation of piece-part reliabilities and their combination into reliability block models of the launch system These block models include consideration of the criticality of individual components the presence or absence of redundant capabilities the likelihood that one component failure might cause a failure in another component as well as other needed data By combining the individual piece-part reliabilities in this model the engineering approach produces an overall reliability estimate for the launch system The engin~ng approach has several significant limitations that tend to reduce confidence in its results First the approach assumes that the interrelationships among and between sub-systems are understood sufficiently to enable development of a reliability block diagram This assumption is highly questionable in complex systems such as space launch vehicles whose operational histories include many anecdotes regarding unexpected relationships between independenf sub-systems The second drawback of the engineering approach is that it assesses the reliability of the system in a perfectly assembled condition As a result it assesses reliability without regard to manufacturing processing or operations variations and errors Effects typically overlooked or ignored include a Improper installation of components Erroneous computer programs 9/10/96 13 RTI [PAGE 23] Insertion of improper computer programs Support-personnel fatigue A third limitation of the parts-analysis approach discussed in Ref deals with the subjectivity and invalid assumptions often used to estimate piece/component reliabilities Here Booz•Allen quotes from a reporf by the Office of Technology Assessment and we do likewise The design reliability of proposed vehicles is generally estimated using Data from laboratory tests of vehicle systems e.g engines and avionics and components that have already been built Engineer's judgments about the reliability- achievable in systems and components that have not been built Analyses of whether a failure in one system or component would cause other systems and components or the vehicle to fail and Assumptions often tacit that the laboratory conditions under which systems were tested precisely duplicate the conditions under which the systems will operate the conditions under which the system will operate are those under which theywere designed to operate the engineer's judgments about reliability are correct and the failure analyses considered all circumstances and details that influence reliability Such engineering estimates of design·reliability are incomplete and subjective Effects influencing reliability that the analyst may fail to consider include a Lightning strikes Aging effects particularly for solid propellants Corrosion Insufficient heat or cold insulation for critical components e.Idng Erroneous antennae patterns or instrumentation Booz Allen concludes as follows Finally due to its nature the engineering approach can not account for undetected design flaws If these flaws were detected and could be modeled 9/10/96 14 RTI [PAGE 24] they would be corrected However experience has shown that design flaws do cause failures in operational launch systems and will likely do so in the future The major objection to the parts-analysis approach hinted at above but not actually expressed is that all such approaches involve either explicitly or implicitly a so-called factor The K-factor is included in the reliability calculations in an attempt to compensate for the fact that the environment in which a part or system is tested is not the same as the flight environment Since the K-factor is surely not the same for all components and systems multiple values must be assumed and the entire process becomes highly subjective In view of the objections and limitations just presented in this report the parts-analysis approach is not considered in assessing vehicle reliability or in estimating the relative probabilities of occurrence of the various failure-response modes 4.2 The Empirical Approach A seemingly more objective way to evaluate vehicle reliability or conversely vehicle failure probabilities is by examining the actual performance of flight-tested vehicles In support of this approach the following is quoted from the Office of Technology Assessment report previously referenced The only completely objective method of estimating a vehicle's probability of failure is by statistical analysis of number of failures observed in identical vehicles under conditions representative of those under which future launches will be attempted Although we agree with the Office of Technology Assessment statement the obvious difficulty with this approach is that no such sample of identical vehicles exists or is ever likely to exist In their report 41 previously referenced Booz Allen makes the same point in different words by stating that the empirical approach has one significant drawback in that it can not project the effects of changes in the launch systems The effects of such changes can only be assessed objectively by further flight testing The difficulty in projecting success rates or failure rates from past tests to future tests is clearly recognized Nevertheless RTI has relied exclusively on this method to estimate the relative probabilities of occurrence for the various failure-response modes Even so total objectivity cannot be claimed since as will be seen later the answers depend to a large extent on how the performance data are filtered and how big a risk one wants to take that the true failure probability is underestimated 9/10/96 15 RTI [PAGE 25] Computation of Failure Probabilities The test results for Atlas Delta and Titan in the tables of Appendix have been used for three primary purposes To predict or estimate the overall probability that each vehicle will fail during the various phases of flight see Table 39 Appendix for flight-phase definitions To establish the relative and overall probabilities for Response Modes through To establish the relative frequency of tumble for Response Modes and 5.1 Overall Failure Probat>ility To- predict failure probabilities for Atlas Delta and Titan the test results in Appendix for representative configurations i.e in last column have been filtered using three different weighting techniques described in Appendix Equal weighting Index-count weighting Exponential weighting In computing filtered or weighted failure probabilities a test is assigned a score of one to indicate the occurrence of a failure or some anomalous behavior and a score of zero if no failure occurred Admittedly there may be disagreements about the classification of a few flights since the launch agency may consider as successful or partially successful some flights that are shown as failures in Appendix To avoid such disagreements it is better to- think of some non-normal events particularly those occurring late in flight as anomalies rather than failures The flight phases as shown in column of Table and defined in Appendix D.1.3 are inclusive e.g flight phase includes phases 1.5 2.5 and An NA in the response-mode column in the tables of Appendix indicates that some failure or anomalous behavior has had an effect on the final orbit or impact point without producing additional risks to people on the ground or necessarily failing the mission In the failure-probability calculations of Table and Table an NA has been- considered as a success for all flight phases except irrespective of the phase in which the failure or anomalous behavior took place Only in flight phase is an NA response considered a failure The filtered results for representative configurations defined in Appendix D.1.4 are given in Table for six flight phases For flights with multiple entries in the Response-Mode and Flight-Phase columns e.g see Appendix D.2.1 No 257 the first listed value was used in the filtering process 9/10/96 16 RTI [PAGE 26] Table Predicted Failure Probabilities for Representative Configurations Vehicle Flight Phase Filter Technic ue Sample Failures Total Equal Weight Index Count Expon 0.99 Expon 0.98 Expon 0.97 Atlas 0/7 0-1 0.0256 0.0253 0.0245 0.0219 0.0186 4/156 0-2 0.0449 0.0385 0.0387 0.0313 0.0243 7/156 0-3 0.0769 0.0715 0.0714 0.0643 0.0568 12/156 0-4 0.0833 0.0811 0.0801 0.0740 0.0663 13/156 0-5 0.1090 0.1100 0.1078 0~1019 0.0929 17/156 Delta 0/125 0-1 0.0160 0.0126 0.0134 0.0104 0.0075 2/125 0-2 0.0160 0.0126 0.0134 0.0104 0.0075 2/125 0-3 0.0160 0.0126 o.0134 0.0104 0.0075 2/125 0-4 0.0160 0.0126 0.0134 0.0104 0.0075 2/125 0-5 0.0640 0.0447 0.0535 0.0469 0.0442 8/125 Titan 0.0306 0.0210 0.0225 0.0292 0.0352 3/98 0-1 0.0234 0.0305 0.0314 0.0403 0.0470 4/171 0-2 0.0409 0.0496 0.0514 0.0642 0.0750 7/171 0-3 0.0526 0.0581 0.0597 0.0689 0.0773 9/171 0-4 0.0526 0.0581 0.0597 0.0689 0.0773 9/171 0-5 0.1111 0.1167 0.1188 0.1284 0.1358 19/171 Includes response mode NA It is apparent from the data in Table that estimates of future vehicle reliability depend on the filtering i.e weighting technique applied Since there are many ways to perform the filtering all generally producing slightly different results the choice of method to use in deriving empirical failure probabilities cannot be totally objective Subjective decisions must also be made about which past configurations to consider as representative of future vehicles which flight tests to include in the sample how to weight the individual flights and in unusual cases whether to consider a flight a success or a failure and to which flight phase to attribute a failure Except for data weighting i.e choice of filter these decisions were made for Atlas Delta and Titan before computing the failure probabilities shown in Table For Atlas and Delta it can be seen from Table that the predicted failure probabilities computed with the exponential filter decrease as the value of decreases Since a decreasing means more emphasis on recent data and less emphasis on the old the launch reliability for these vehicles is apparently improving The reverse seems to be true for Titan suggesting either that Titan reliability is not improving or possibly that improvements that have been or are being made to the vehicle are not yet fully reflected in the test results For Atlas and Delta the computed failure probabilities based on equal weighting are higher than for all other filters and the predicted failure 9/10/96 17 RTI [PAGE 27] probabilities using index-count filtering are larger than those for exponential filtering For Titan the results are mixed further suggesting that Titan reliability has not improved in recent years For comparison purposes the same filtering techniques have been applied to all flight tests shown in the tables of Appendix regardless of configuration The results are presented in Table Table Predicted Failure Probabilities for All Configurations Vehicle Atlas Delta Flight Phase 0-1 0-2 0-3 0-4 0-5 0-1 0-2 0-3 Filter Technic ue Sample Failures Total 0/7 56/532 91/532 111/532 114/532 137/532 0/196 4/232 6/232 10/232 Equal Weight 0.1053 0.1711 0.2086 0.2143 0.2575 0.0172 0.0259 0.0431 Index Expon Expon Count 0.99 F=0.98 0.0641 0.0422 0.0273 0.0990 0.0555 0.0311 0.1261 0.0802 0.0559 0.1330 0.0873 0.0627 0.1671 0.1150 0.0866 0.0164 0.0148 0.0110 0.0232 0.0201 0.0133 0.0279 0.0263 0.0150 Expon 0.97 0.0190 0.0204 0.0455 0.0511 0.0725 0.0077 0.0085 0.0089 0-4 0-5 Titan 0-1 0-2 0-3 0-4 0-5 0.0431 0.1078 0.0306 0.0534 0.1424 0.1632 0.1662 0.1958 0.0279 0.0766 0.0137 0.0319 0.0771 0.0924 0.0942 0.1369 0.0263 0.0740 0.0187 0.0351 0.0719 0.0830 0.0840 0.1326 0.0150 0.0536 0.0281 0.0399 0.0662 0.0711 0.0712 0.1277 0.0089 10/232 0.0459 25/232 0.0349 3/98 0.0467 18/337 0.0750 48/337 0.0770 55/337 0.0771 56/337 0.1346 66/337 Includes response mode NA A comparison of Table and Table shows that in most cases but not all exponential filtering produces failure probabilities for the representative configuration samples that are smaller than the corresponding probabilities for the all-configuration samples The fact that most differences between corresponding samples are relatively small attests to the effectiveness of the exponential filter in down-weighting early launch failures This is not the case for equal weighting of tests where the predicted failure probabilities based on all configurations are up to 3.6 times as large With respect to- the weighting of missile and space-vehicle performance data RTI favors an exponential filter over either the equal-weight or index-count filters Weighting percentages for the three filters are given in Table for sample sizes of to 1,000 Except for small samples the percentages produced by equal weighting place too much emphasis on old data thus failing to account for the learning process and 9/10/96 18 RTI [PAGE 28] hardware improvements that have taken place through the years For samples approaching 100 or so it seriously over-weights the old data and under-weights the more recent events Although equal weighting does not seem suitable for this application it could be appropriate in other large-sample situations for example predicting the failure probability of devices that are all manufactured at the same time by the same process and tested to the same standards Table Comparison of Weicllting Percentages Sample Size Filter Last+ Point Last5 Points Last 10 Points Last 25 Points Last 50 Points Last Half Expon Index Equal 25.8 40.0 25.0 51.0 70.0 50.0 10 Expon Index Equal 10.9 18.2 10.0 52.5 72.7 50.0 100.0 100.0 100.0 52.5 72.5 50.0 20 Expon Index Equal 6.0 9.5 5.0 28.9 42.9 25.0 55.0 73.8 50.0 55.0 73.8 50.0 100 Expon Index Equal 2.3 2.0 1.0 11.1 9.7 5.0 21.1 18.9 10.0 45.7 43.6 25.0 73.3 74.8 50.0 73.3 74.8 50.0 200 Expon Index Equal 2.0 1.0 0.5 9.8 4.9 2.5 18.6 9.7 5.0 40.4 23.4 12.5 64.7 43.7 25.0 88.3 74.9 50.0 500 Expon Index Equal 2.0 0.4 0.2 9.6 2.0 1.0 18.3 4.0 2.0 39.7 9.7 5.0 63.6 19.0 10.0 99.4 75.0 50.0 1000 Expon Index Equal 2.0 0.1 0.1 9.6 1.0 0.5 18.3 2.0 1.0 39.7 4.9 2.5 63.6 9.7 5.0 99.996 75.0 50.0 0.98 for exponential filter Last refers to the most recent data point The index-count filter has serious deficiencies when applied to either small or large samples of missiles and space vehicles For small samples too much emphasis is placed on recent data For a sample of four 40% of the total weight is given to the last test and 70% to the last two tests For a sample of ten 18.2% of the total weight is given to the last test and 72.7% to the last five tests The reliability improvement rate implied by these weightings seems too optimistic unless there were serious design flaws in the early configurations that were discovered and corrected Since many types of failures surely exist that occur only once in 50 or once in 100 or more launches the tenth launch may be no better than the first for predicting the probability of occurrence of such failures For large samples the index-count filter under-weights current data 9/10/96 19 RTI [PAGE 29] more and more as the sample size increases For samples of 200 500 and 1000 the weighting of the last 50 tests are in each case 43.7% 19.0% and 9.7% of the total weight For samples of 100 or more no matter how large the index-count filter assigns 25% of the data weight to the oldest half of the data sample too much in RTI's opinion For missiles and space vehicles the data weightings imposed by the exponential filter 0.98 appear reasonable For small samples less than 20 or so there is little difference between equal and exponential weightings For sample sizes near 80 the index-count and exponential filters produce similar results For sample sizes of 200 and more the weights assigned to the most recent 10 25 and 50 tests are essentially constant showing the fading-memory nature of the exponential filter The denominator of the exponential-filter equation Eq 18 Appendix CJ is a geometric series that asymptotically approaches a limit of 1/(1- as approaches infinity For 0.98 that limit is 50 Thus the last data point which is always given a weight of one can never be weighted less than of the total no matter how large the sample For samples of 200 and 300 the oldest half of the data receives only 11.7% and of the total weight For samples of 500 and larger the oldest half of the data sample is essentially o~tted altogether The exponential filter is clearly a fading-memory filter as it should be for space-vehicle performance data Having decided upon the exponential filter as the best method for weighting missile and space-vehicle performance data a filter constant must be chosen To see how data weighting varies with filter-factor value weighting percentages for various samples were computed for representative configurations of Atlas Delta and Titan using values of from 0.96 to 0.995 The results are shown in Table 9/10/96 20 RTI [PAGE 30] Table Filter Factor Influence on Weig hting Percentages Vehicle Filter Last Last 10 Last 50 Last Lastl00 Pt Ratio sample Cons't Point Points Points Half Points last first Atlas 0.96 4.01 33.6 87.2 96.0 98.5 560 156 0.97 0.98 0.99 0.995 3.03 2.09 1.26 0.92 26.5 19.1 12.1 9.0 78.9 66.4 49.9 40.9 91.5 82.9 68.7 59.7 96.1 90.6 80.1 72.7 112 22.9 4.7 2.2 Delta 4.02 33.5 87.5 92.9 98.9 158 125 0.97 0.98 0.99 0.995 3.07 2.17 1.40 1.07 26.9 19.9 13.4 10.5 80.0 69.1 55.2 47.6 87.3 78.3 65.6 58.2 97.4 94.3 88.6 84.7 43.7 12.2 3.5 1.9 Titan 0.96 4.00 33.5 87.1 97.1 98.4 1030 171 0.97 0.98 0.99 0.995 3.02 2.07 1.22 0.87 26.4 18.9 11.7 8.5 78.6 65.7 48.1 38.5 93.2 85.1 70.5 60.8 95.8 89.6 77.2 68.5 177 31.0 5.5 2.3 Last half if sample size is odd Although the choice of a filter constant cannot be completely objective use of a value less than 0.97 or greater than 0.99 produces undesirable weightings For 0.96 for example the most recent test result for Titan is weighted 1030 times that for the oldest test the last 50 data points receive 87.1 of the total weighting leaving only 12.9% for the first 121 flights the last 100 flights receive 98.4% of the total weighting thus in effect omitting the oldest 71 flights from the solution At the high end of the spectrum a value of 0.995 fails to down-weight the old test results sufficiently Using Atlas as an example the most recent data point 1/31/96 is weighted only 2.2 times that of the oldest data point 8/14/64 The oldest half of the data stretching from 8/14/64 to 3/06/73 receives 40% of the total weight and the earliest 56 launches comprising 36% of the data receive 27% 100 73 of the total weight This is not too different from equal weighting of tests a procedure that fails to acknowledge the improvements in Atlas reliability that have taken place over a period of 32 years In choosing a value of an attempt is made to strike a suitable balance between two contrary objectives to down-weight substantially those failures for which the probability of occurrence has been greatly reduced through redesign and replacement of components improved test procedures and the like 9/10/96 21 RTI [PAGE 31] to down-weight only slightly or not at all those failures that are random in nature that can still occur in replacement components or that occur only once in 100 or several hundred launches in components that have not yet failed No matter what technique is employed filtering is at best a compromise The perfect filter would somehow down-weight to some extent or entirely those failures that have been fixed or made less likely without down-weighting those random failures with unknown causes The filters considered in this study have no such capabilities they produce a result based solely on the launch sequence and where in the sequence failures have occurred In predicting vehicle failure probabilities from empirical data large representative samples are essential for a good estimate and the more reliable the vehicle the greater the need for a large sample For example if some characteristic exists in exactly of a population the probability is 0.37 that it will not appear in a random sample of 100 and 0.61 that it will not appear if the sample size is 50 If the characteristic exists in of the population it fails to- appear about 36% of the time in a random sample of 50 For reasons presented above the data samples for Atlas Delta and Titan have been made as large as possible consistent with the notion of representative configurations as set forth in Ref In RTI's judgment the value of that best weights the performance data is 0.98 although a value anywhere in the interval 0.97 to 0.99 cannot be ruled out For consistency in data weighting the same values of have been used for all vehicle programs The differences in predicted failure probability that result from these three F's are illustrated in Figure for Atlas The plots show the inverse relationship between filter volatility and the value of For 0.97 vis-a-vis larger values it can be seen that the filtered failure probability jumps higher with each failure and drops at a faster rate with each successful launch that follows 9/10/96 22 RTI [PAGE 32] 0.12 0.11 0.10 0.09 0.08 a ca 0.07 a 0.06 lo 0.05 ffi 0.04 lo 0.03 0.02 0.01 0.00 i o.97 i i i i i i i i i 0~98 1·················1·················1·················j···-----i••F 99 i i i LI -~:t-1-1 OOOOOOOppO&aOOOOO ooOOOOOOOOOOOOO OOOOOO OOOOOOOHO OOOOO OHHOOOOOO --600000000 I i i 20 40 60 80 100 120 140 160 Sample Index newer- igure Filter Factor Results for Representative Configurations of Atla In summary it must be recognized that there is no correct value for and that it is even difficult to argue generally that one value of is better than another In RTI's view values of below 0.97 place too much emphasis on a relatively small sample of recent launches Values above 0.99 extend the sample so far back in time that too little emphasis is placed on improvements in design materials and operational procedures In any event the value chosen for is crucial in arriving at a predicted failure probability For the more conservative a value of 0.99 can be chosen the optimistic might chose 0.97 Since most risk-analysis studies that RTI makes are concerned with the launch area failure probabilities beyond flight-phase are of minor interest The overall failure probabilities shown in Table have with one exception been extracted from Table for 0.98 Where a best estimate is called for RTI plans to use these probabilities in future launch-area risk analyses for the 45 SW SE unless directed otherwise or until additions to the data samples in Appendix justify changes 9/10/96 23 RTI [PAGE 33] Table Failure Probabilities for Atlas Delta and Titan Predicted Failure Probability Vehicle Atlas Delta Flight Phase 0-1 0.022 0.010 Flight Phase 0-2 0.031 0.013 Titan 0.040 0.064 Exponential filter with 0.98 For Delta the predicted failure probabilities shown in Table for flight-phases and are the same since no second-stage failure has occurred in the 125 flights included in the representative sample Obviously this does not mean that the probability of a Delta second-stage failure is zero As stated earlier the choice of is a judgment matter with the most reasonable range for considered to be 0.97 SF 0.99 To- show a difference in failure probabilities between Delta flight phases a value of 0.98 has been used for flight phases and 0.99 for flight phases It is an interesting coincidence that the same value of 0.013 is obtained using 0.98 and all I Delta configurations see Table Another way to estimate the Delta second-stage I failure probability is to calculate an upper confidence limit at some suitable level for an event that has occurred zero times in 125 trials At the 80% confidence level the I reliability is at least 0.987 so- the failure probability during second-stage bum flight phases 1.5 is no bigger than 0.013 I 5.2 Relative and Absolute Probabllltles for Response Modes I For Atlas Delta and Titan vehicles failure-response Modes and are much less I likely to- occur than Modes and Since the probabilities of occurrence for the less- likely modes may be only one in a thousand or less such responses may not have occurred at all in the flight tests of representative configurations In fact in the I combined samples for Atlas Delta and Titan only 16 failures have occurred during flights phases None of the 16 resulted in response-modes or Because of the small number of failures in the representative configuration samples the relative probabilities of occurrence for Modes through have been estimated using results from all vehicle configurations and launches shown in Appendix The rationale for this approach is that except for obvious problems that have been corrected other changes made through the years to improve vehicle reliability have reduced the probabilities of occurrence of all response modes more or less proportionally The greater significance of more recent vehicle modifications and test results is accounted for by using an exponential filter to estimate overall failure probabilities Thus if Mode-1 failures occurred more frequently in the distant past than in recent years the weighting process reduces the significance of the earlier Mode-1 responses in the relative probability-of-occurrence calculations As tabulated from Appendix the number count of failures by response mode and flight phase for Atlas Delta Titan and Eastern-Range Thor launches are given in Table through Table 10 Thor launches 9/10/96 24 RTI [PAGE 34] from the Western Range were not included since available performance records were incomplete The results for the four vehicles are combined in Table 11 Table 12 gives last-occurrence dates by response mode for each launch vehicle Table Number of Atlas Failures All Confisrurations 532 Flights Flight Failure-Res onse Mode 3&4 Phase NA Tumble 0-1 38 11 0-2 66 15 13 19 0-3 86 15 18 25 0-4 89 15 21 27 0-5 89 15 23 27 Table Number of Delta Failures All Configurations 232 Flights Flight Failure-Res oonse Mode 3&4 Phase NA Tumble 0-1 0-2 10 0-3 12 13 0-4 15 0-5 Table Number of Titan Failures All Configurations 337 Flights Flight Phase Fail ure-Res oonse Mode NA 3&4 Tumble 0-1 13 0-2 39 10 0-3 46 11 0-4 47 11 0-5 47 10 11 Table 10 Number of Eastern-Range Thor Failures 85 Flights Flight Failure-Res oonse Mode 3&4 Tumble Phase NA 0-1 0-2 0-3 0-4 0-5 15 20 22 22 22 9/10/% 25 RTI [PAGE 35] Table 11 Number of Failures for All Vehicles 1186 Flights Flight Phase Fail ure-Res oonse Mode NA 3&4 Tumble 0-1 0-2 0-3 0-4 0-5 13 13 13 13 13 68 129 161 165 165 15 27 28 28 28 11 29 38 45 53 19 33 40 42 42 Table 12 Date of Most Recent Failure Response Vehicle Mode Atlas Delta Titan Thor 03/02/65 none 12/12/59 04/19/58 12/18/81 none 05/01/63 12/30/58 04/25/61 none none 07/21/59 08/22/92 05/03/86 10/05/93 03/24//64 12/08/80 08/27/69 11/30/65 01/24/62 Last Thor launch was 02/23/65 For the reasons advanced previously an exponential filter has been used to estimate relative probabilities of occurrence for Modes through and the fraction of Mode-3 and Mode-4 failures that tumble while the vehicle is thrusting The percentage weightings for various data samples are shown in Table 13 for values of from 0.980 to 0.999 Because of the large size of the composite sample 1186 the filter-control constant of 0.98 used previously to estimate absolute failure probabilities for individual vehicles does not seem suitable for estimating relative probabilities for the individual response modes Use of 0.98 would effectively place 98.2% of the total weight on the most recent 200 tests thus in effect eliminating the earliest 986 tests from the solution These are the very tests needed to provide an adequate sample of failures from which to estimate relative frequencies of occurrence of the individual response modes 9/10/96 26 RTI [PAGE 36] Table 13 Percentage Weighting for Sample of 1186 Launches ter Last Last 100 Last200 Last 300 I i:st 500 Point Ra Point Points Points nstant Points Points Last:Fir 0.999 0.14 13.7 26.1 37.3 56.7 3.3 0.996 0.40 33.3 55.6 70.6 87.3 1.2 1()2 0.995 0.50 39.5 63.5 78.0 92.1 3.8x 1()2 0.994 0.60 45.3 70.0 83.6 95.1 1.3x Hf 0.993 0.70 50.5 75.5 87.9 97.0 4.2 l(f 0.992 0.80 55.2 79.9 91.0 98.2 1.4 10 0.991 0.90 59.5 83.6 93.4 98.9 4.5 10 0.990 1.00 63.4 86.6 95.1 99.3 1.5x Hf 0.980 2.00 86.7 98.2 99.8 99.996 3.9 10 11 The value of 0.999 is considered inappropriate because as seen in Table 13 the weighting factor applied to the most recent datum is only 3.3 times that applied to the oldest test result from 39 years ago The most recent 200 and 300 points in the sample comprising 16.8% and 25.2% of the data receive only 26.1 and 37.3% of the total weight This is not too different from equal weighting of data which is appropriate only if the relative frequency of occurrence of each response mode has not changed significantly through the years On the other hand use of 0.99 effectively throws out the oldest 600 to 700 launches that are sorely needed for an adequate sample size The results of the filtering process are given in Table 14 for failures during flight phases Table 14 Response-Mode Occurrence Percentages Filter Respcnse Mode Factor 0.999 7.39 2.27 1.70 73.30 15.34 0.996 2.24 4.35 0.37 80.37 12.67 0.995 1.32 4.92 0.19 82.59 10.98 0.994 0.993 0.992 0.991 0.73 0.39 0.20 0.11 5.26 5.37 5.31 5.13 0.09 0.04 0.02 0.01 84.57 86.25 87.68 88.92 9.35 7.95 6.78 5.84 0.990 0.05 4.87 0.00 90.02 5.06 0.980 0.00 1.86 0.00 96.81 1.33 The results in Table 14 show that the percentages of occurrence for response-modes and are relatively insensitive to filter-factor values while the percentages for Modes and decrease as filter memory filter factor decreases This suggests that occurrences of Modes and have been decreasing over the years while Modes and occurrences have not changed much Although it cannot be argued convincingly 9/10/96 27 RTI [PAGE 37] that 0.993 is superior to 0.992 or 0.994 or even values outside this interval a value of 0.993 was chosen This section has thus far described a rationale for selecting a filtering process and filter constant to estimate percentages of occurrence of failure-response modes for Atlas Delta and Titan launch vehicles These are mature launch systems with improved reliability as a result of years of experience and corrections of problems Although the designs of new launch vehicles may be based to some extent on mature systems new systems are expected to fail at a higher rate For vehicles with liquid-propellant stages burning at liftoff the percentages of occurrence of the various response modes are more likely to be similar to the earlier versions of Atlas Delta and Titan than to current vehicles For lack of any other data for such new liquid-propellant systems the relative percentages for the five failure-response modes have been calculated using the total combined sample of Atlas Delta Titan and Thor with a filter constant of 0.999 almost equal weighting For new solid-propellant vehicles use of 0.999 results in a Mode-1 percentage that seems much too high All of the 13 Mode-1 failures in the composite sample Table 11 involved liquid-propellant vehicles whereas none of the Atlas Delta or Titan configurations with solid-propellant boosters have experienced a Mode-1 response On the other hand use of 0.993 that is applied for mature launch systems seems to reduce the probability of a Mode-5 response too much since a Red Tigress vehicle and a Joust vehicle launched at the Cape in 1991 both experienced Mode-5 failure responses see Section As a compromise between new and mature liquid-propellant vehicles a value of 0.996 has been assumed for new solid-propellant vehicles The percentages shown in Table 15 for flight phases have been·obtained from Table 14 Similar information for flight phases are given in Table 16 In future risk studies for the 45 SW SE RTI plans to use these relative percentages for mature and new systems Table 15 Recommended Response-Mode Percentages for Flight Phases Response Mature caunch Mode Svstems 0.993 0.4 5.4 0.1 86.2 7.9 New Solid Systems New Liquid Systems 0.996 0.999 2.2 7.4 4.3 2.3 0.4 1.7 80.4 73.3 12.7 15.3 9/10/96 28 RTI [PAGE 38] Response Mature Launch New Solid Systems New Liquid Systems Mode stems 0.993 0.996 0.999 0.5 3.4 10.7 7.4 6.6 4.3 0.1 0.6 2.4 81.9 74.5 67.0 10.1 14.9 15.6 Absolute probabilities of occurrence for response Modes through can be obtained by multiplying the absolute failure probabilities for flight phases and Table by the relative failure probabilities in Table 15 and Table 16 The results are shown in Table 17 Probabilities are listed to six decimal places to show differences not because all figures are actually significant To obtain these results more precise values for relative probabilities of occurrence were used than shown in Table 15 and Table 16 Table 17 Absolute Failure Probabilities for Response Modes Vehicle Atlas Delta Titan Flight Phase 0-1 0-2 0-170 sec 0-280 sec 0-1 0-2 0-270 sec 0-630 sec 0-1 0-300 sec 0-2 0-540 sec Model Mode2 Mode3 Mode4 0.000119 0.000121 0.001637 0.001665 0.000011 0.000012 0.018007 0.026738 0.000054 0.000051 0.000744 0.000698 0.000005 0.000005 0.008185 0.011212 0.000216 0.002976 0.000020 0.032740 0.000250 0.003437 0.000026 0.055200 Modes 0.002226 0.002465 0.001012 0.001034 0.004048 0.005088 Total 0.022 0.031 0.010 0.013 0.040 0.064 For each vehicle the absolute probabilities for Modes and iffer slightly for flight phases and This difference is due to the unequal data weighting produced by the exponential filter If equal data weighting had been applied the absolute probabilities for these modes would have been identical as expected since Modes and cannot occur beyond flight phase Differences in absolute probabilities for Modes and for flight phases and can also be seen in the table A part of this difference may result from unequal data weighting but primarily it is due to the obvious fact that fewer Mode and failures have occurred during flight phase than during the longer span of flight phase 9/10/96 29 RTI [PAGE 39] 5.3 Relative Probability of Tumble for Response-Modes and Exponential filters with values of from 0.98 to 0.999 have been used to- estimate the percentage of Mode-3 and Mode-4 responses that tenninate with a thrusting tumble Results are given in Table 18 for flight phases and For launch-area risk calculations only flight phases are of interest The data sample was a chronological composite of all Atlas Delta Titan and Thor tests and configurations shown in Appendix To several decimal places at least the values in the table are determined entirely from Mode-4 responses since the last vehicle to experience a Mode-3 response 4/25/61 is weighted out of the solution The results in Table 18 are based ona total sample size of 1,186 flight tests Table 18 Percent of Response Modes and That Tumble Filter Factor Flight Phases Flie.:ht Phases 0.999 25.0 25.0 0.996 26.3 27.0 0.993 27.3 28.6 0.990 28.3 30.1 0.980 31.3 34.8 Through flight phase there were 33 tumbles out of a total of 132 Mode-3 and Mode-4 responses Through flight phase there were 42 tumbles out of 168 Mode-3 and Mode-4 responses As seen from Table 13 the smaller the filter factor the greater the weight placed on recent test data In view of this it is apparent from Table 18 that the percentage of Mode-4 responses that end with a thrusting tumble has been increasing gradually The same conclusion is reached for flight phases and In recognition of this gradual increase in future studies RTI will assume that approximately one-third of Mode-3 and Mode-4 failure responses end with a thrusting tumble 9/10/96 30 [PAGE 40] Shaping Constants Through Simulation Since adequate test data are not available to establish the Mode-5 shaping constants empirically other methods are needed for this purpose It will be recalled that after vehicle pitchover any malfunction with the potential to cause a substantial deviation from the intended flight line is by definition a Mode-5 failure response The malfunction need not actually cause a large deviation to be classified as a Mode-5 response One such class of failures leading to a Mode-5 response has been termed a random-attitude failure Such responses can result from guidance and control failures that lead to erroneous orientation of the guidance platform or an erroneous spatial target Another class of failures that can cause sustained deviation away from the flight line is the slow turn where the engine nozzle in effect locks in some fixed position generally but not necessarily near null Both types of malfunctions have been investigated in an attempt to estimate numerical values for Mode-5 shaping constants A and Basically the idea is to run a large sample of random-attitude and slow-tum failures calculate the percentages of impacts in five-degree sectors from to 180° compare these percentages with those obtained from the Mode-5 impact density function when specific values are assigned to A and and assign values to A and until the best pos~ible fit is obtained between the simulated-tum impacts and the theoretical Mode-5 impacts 6.1 Malfunction Turn Slmulatlons 6.1.1 Random-Attitude Failures A guidance and control failure leading to a fixed erroneous direction of thrust is termed a random-attitude failure Such failures represent a subset of possible Mode-5 failure responses Random-attitude failures can be used to establish the maximum possible region of impact given that a vehicle has flown normally for a specified period of time For this purpose RTI has developed a Random-Attitude Failure Impact Point RAFIP program written in Fortran 3900 lines of code for execution on a personal computer Using a Monte Carlo approach program RAFIP first selects a starting time and then a random thrust direction on the attitude sphere with all directions having the same chance of being chosen Each Monte-Carlo run is begun using the nominal vehicle position and velocity at the selected start time assuming an instantaneous change in thrust direction Thrust is applied continuously in the selected random direction and the equations of motion are numerically integrated until one of four conditions is satisfied final stage burnout occurs the vehicle impacts while thrusting orbital insertion occurs the vehicle breaks up due to aerodynamic forces For conditions and the trajectory is extended to impact using Kepler's equations For condition an impact point does not exist The process just described is repeated 9/10/% 31 RT [PAGE 41] for a suitably large sample so the distribution of resulting impact points will for all practical purposes represent all possible impact points irrespective of the actual nature of the failure Depending on vehicle breakup characteristics and failure time a vehicle that experiences a random-attitude failure may break up at the instant of failure or after a few seconds into the tum or not at all In making the calculations three separate breakup thresholds and a no-breakup case were investigated With respect to vehicle breakup the assumption was made that the vehicle would break up if qa exceeded a specified constant limit where is the dynamic pressure and a is the total angle of attack Although the breakup qa may well be a complicated function of Mach number and other parameters this simplistic approach was taken Random-attitude-failure calculations were made individually for Atlas Delta Titan and LL Vl starting shortly after pitchover and continuing to some convenient time such as a stage burnout when the vehicle could no longer endanger the launch area Theoretically the Mode-5 impact density function extends downrange until the instantaneous impact point vanishes Since this study is concerned with evaluation of density-function parameters for launch-area risk analysis the random-attitude calculations were stopped at a staging event when the vehicle no longer had sufficient energy to return the impact point to the launch area Using trajectory data for each vehicle program RAFIP was run to generate 10,000 impact-point samples at each starting time Calculations were made at ten-second intervals 6.1.2 Slow-Turn Failures Certain types of guidance and control failures can cause the thrusting engine to gimbal to null or a near-null position Such failures can produce what is herein called a slow tum For various reasons after an engine is commanded to null it may not thrust precisely through the center of gravity e.g structural misalignments shifting center of gravity canted nozzles Since like random-attitude failures slow turns constitute a subset of Mode-5 failure responses they have been investigated using RTI program RAFIP The following assumptions have been made in making the calculations The effective thrust offset of a nulled engine is normally distributed with a zero mean and a standard deviation of 0.1 A fixed thrust offset results in a constant angular acceleration of the airframe and thus a constant angular acceleration of the thrust vector For small thrust misalignments the angular acceleration of the airframe is proportional to the angular thrust misalignment At each time point the angular acceleration produced by small thrust offsets was estimated from the malfunction turn data provided to the safety office by the range user Malfunction turns for the Atlas IIAS were provided for three gimbal angles the smallest being one degree For each gimbal angle the results were plotted as 9/10/96 32 RTI [PAGE 42] cumulative angle turned versus time Since the slope of the curve i.e the turning rate is greatest when the thrust and thus airframe is directed at right angles to the velocity vector the average angular acceleration during the first 90° of rotation was obtained from the equation so that 8(deg 180 deg sec sec where is the elapsed time from the beginning of the tumble tum until the airframe has rotated approximately 90° If the assumption is made that the angular acceleration is directly proportional to the thrust offset angle i.e nozzle deflection the angular acceleration for any small deflection angle becomes where is the angular acceleration computed from Eq for deflection angle for Atlas IIAS and is some small deflection angle Using the Atlas IIAS data angular accelerations were computed at ten-second intervals from the programming time of 15 seconds to 275 seconds for For each starting time a normal distribution with zero mean and a standard deviation of 0.1° was sampled to obtain an initial thrust misalignment to substitute in Eq The resulting angular acceleration was applied throughout the tum Slow-tum calculations were made in a manner analogous to the random-attitude turns using the reference trajectory to obtain the starting position and velocity components The slow turn was assumed to occur in a randomly oriented plane containing the starting velocity vector Each turn was carried out until one of the four conditions listed in Section 6.1.1 for random-attitude turns was met For conditions and impact points were calculated and along with thrusting impacts from condition summed for each five-degree sector from to 175° At each starting time 10,000 impact-point calculations were made 6.1.3 Factors Affecting Malfunction-Turn Results Random-attitude turns and slow turns are only subsets of the totality of Mode-5 failure responses As discussed earlier in Section other types of behavior following a Mode- failure are numerous and largely impossible to categorize much less simulate Ideally impact distributions from all types of Mode-5 responses should be combined before results are compared with those obtained from the theoretical Mode-5 impact 9/10/96 33 RTI [PAGE 43] density function Since this could not be done in general impacts from only the two types of malfunction turns were considered Several factors affect the results of the simulations a Weighting of tum data Both random-attitude and slow-tum simulations were made for Atlas HAS In combining impacts from the two data sets random- attitude turns were assumed to be three times as likely to occur as slow turns A factor of three was selected since among the Mode-5 failure responses in the performance summaries for Atlas Delta and Titan random-attitude turns appeared to occur about three times as often as slow turns In many cases lack of detailed information made it difficult to decide whether a Mode-5 response should be considered as a random-attitude tum a slow tum or some other type of failure The relative weighting of turns makes little difference however since the impact distribution for the two types of turns are similar as shown later in Figure and since the weighted composite must lie between the two It was assumed that similar results would be obtained for Delta Titan and LCVl so slow-turn computations were not made for these vehicles cutting the number of time-consuming simulations in half Breakup qa In the tum calculations the assumption was made that vehicle breakup would occur if a certain value of qa was reached In addition to the no- breakup case which is considered unrealistic separate runs were made for three constant values of qa 5,000 10,000 and 20,000 deg-lb/ft2 As stated previously the determination of vehicle breakup is in reality much more involved than this simplistic approach would suggest However to add realism to the malfunction- tum calculations use of a simple approach seemed better than none at all For Titan IV allowable but not breakup qa.'s were provided as functions of Mach number The maximum permissible value and corresponding Mach number for Titan/Centaur Titan/NUS and Titan/lUS were respectively 6819 deflb/ft at Mach No 0.77 5332 deg-lb/ft2 at Mach No 0.815 and 17,000 deg-lb/ft at Mach No 0.325 For Atlas Delta and LL Vl vehicles no breakup qa data were available The breakup qa.'s used in the calculations bracket the range of permissible qa.'s for the Titan vehicles End time The simulated impact distributions from random-attitude failures and slow turns were compared with impact distributions computed from the Mode-5 theoretical impact-density function For the comparisons to be meaningful the value selected for in the Mode-5 impact-density equation and the stop time for thrusting-turn simulations must be the same To some extent the shaping constants A and derived by fitting the theoretical and simulated impact data depend on TJY since the percentage of impacts in each sector depends on TB However after A and have been established for a particular TJY using a different TB in the DAMP calculations has no effect on computed risks provided an adjustment is made in the probability of occurrence of a Mode-5 9/10/96 34 RTI [PAGE 44] response Referring to Eq the right-hand member must be multiplied by the probability of a Mode-5 response to obtain absolute probabilities Except for TB itself and to a slight degree shaping constants A and the quantities in the equation do not depend on TB Thus if TB and are both changed so that p/(TB Tp remains constant the computed risks are unchanged If destruct action i.e impact limit lines is included in the DAMP calculations the supplemental risks resulting from that action must be accounted for In this case the termination time has a minor influence on results since it affects the number of impacts that would occur beyond the impact limit lines without destruct that are forced inside when destruct action is taken If destruct action is omitted the value of TB is immaterial i.e supplemental Mode-5 risks are non- existent provided that the impact range along the reference trajectory at time TB exceeds the range to all targets of interest Except in this paragraph supplemental Mode-5 risks are not addressed in this present report Vacuum calculations Atmospheric effects were accounted for in determining when vehicle breakup would occur and to some extent during each thrusting tum by using accelerations from the nominal trajectory To reduce computer time and cost of this study vacuum calculations were made during free fall after vehicle breakup or burnout Although this increased impact dispersions somewhat vacuum results should not be drastically different from those obtainable using a maximum-beta piece In theory at least different mode-5 shaping constants exist for each debris class In view of the uncertainties in vehicle breakup conditions and characteristics and in the overall process of simulating Mode-5 malfunctions attempts to derive unique shaping constants for each debris class did not seem justified 6.1.4 Malfunction-Turn Results for Atlas IIAS For Atlas IIAS the distribution of impacts for simulated random-attitude turns slow turns and a weighted combination 75% random-attitude and 25% slow tum are shown in Figure Since the impact distribution i.e the percentages of impacts in sectors for the weighted composite was not significantly different from that for random-attitude failures slow-turn computations were not made for Delta Titan and LLVl See Ref Section 10 9/10/96 35 RTI [PAGE 45] 100 At~as·ftA~··Fatlu~es··thr9tJgh··2~··sec···j-- u.uo,,L._,._.,._,,,o joooo uL,u~Hn•••nnn Breakap··q~a!Pha··=··20··000tdeg~tblft i i i i I Random-attitude turns I J········sto,~rtumsf···················t I Con,bined urns 75 rahdom 0.25 Slow 10 i i im oouuu•••••••••••+•a.••H••••••••••••~- i uUnu•••••n•o i i i tir'r i i nn••••••••••o-t,unon nH•i••••••.n ou ouHH i t•u t•••••••••••••u•U uu-••1•n•H --•i••••-u•u I i i i nHOn ou••••••----H I I I I I I I 0.1 20 40 60 80 100 120 140 160 180 Angle From Flight Path deg Figure Combined Random-Attitude and Slow-Tum·Results 9/10/96 36 RTI [PAGE 46] 6.2 Shaping Constants for Atlas IIAS 6.2.1 Optimum Mode-5 Shaping Constants available random-attitude failures were simulated for a no-breakup case and for three breakup qa's 20,000 deg-lb/ft2 10,000 deg-lb/ft2 and 5,000 deg-lb/ft2 For each case 270,000 trajectories were run giving a total of 1,080,000 It turned out that the value chosen for the breakup qa was critical in determining shaping constant A since the lower the qa the less the thrusting time before breakup and the higher the percentages of impacts in sectors near the flight line For Atlas HAS the effects of qa on breakup are shown in Figure where for the selected qa's the percentages of random-attitude turns that result in breakup before 280 seconds are plotted against failure time 100 i AtlasillAS 90 I i i i i q-alpha in deg-lb/ff rt 80 I I I q-alpha 000 i cfalptta··;··,-0~600 70 I 60 50 l:i i,,~--1·q·alp1a=20,r0 a a 40 ct1 30 cc i i 20 10 r····················;···················-r 40 80 120 160 200 240 280 Failure Time sec Figure Atlas IIAS Breakup Percentages for Random-Attitude Turns For failures between 10 and 30 seconds most breakups do not occur at failure but later in flight after the vehicle has built up significant velocity For failures between 40 and 105 seconds more than 80% breakup occurs even for qa's as high as 20,000 deg-lb/ft2 9/10/96 37 RTI [PAGE 47] In this region breakup occurs at or shortly after vehicle failure Beyond 170 seconds the dynamic pressure between failure and 280 seconds stays sufficiently low so that the vehicle remains intact The dramatic differences in impact distributions that can result at certain times during flight if the vehicle is subject to aerodynamic breakup can be seen by comparing the impact footprints in Figure and Figure Both patterns show 10,000 impact points from random-attitude failures of the Atlas IIAS at 130 seconds Figure is for no breakup and Figure is for a breakup q<rof 5,000 deg-lb/ft2 The data in Table 19 comprise an example of a 270,000-point sample of random-attitude failures run at 10-second intervals from 15 to 275 seconds For brevity only every- other failure time is shown in the table Ten thousand impacts are computed at each failure time Five-degree sectors are identified in the left-hand column For each time the number of impacts in each sector is shown in·the column for that time The total number of impacts for all failure times and the percentages of impacts in each sector are given in the last two columns of the table 9/10/96 38 RTI [PAGE 48] r,~~--:~~r.- I a Ill C:S a ru 1-1 a I t-tl 1-1 a viOVli:q CLO d..S Figure Atlas IIAS Impacts with No Breakup 9/10/96 39 RTI [PAGE 49] OJ VI I CJ QJ VI OJ If vi~UII a OJ V'I a E,t->rucS I I CT a 1-1 I viOVl oc:5:::5Q.J P=I Figure Atlas IIAS Impacts with Breakup 9/10/96 40 RTI [PAGE 50] Table 19 Sample Impact Distribution for Atlas HAS with No Breakup Failure Time sec 35 55 75 95 115 135 155 175 195 215 235 255 300 411 487 608 835 1107 1843 3333 4092 5386 7906 10000 314 388 465 575 808 1082 1762 3065 3827 4206 2094 316 427 495 627 744 975 1652 2820 2081 408 329 354 464 558 730 945 1445 782 319 378 421 566 670 845 1292 316 349 406 525 641 776 1203 339 337 415 452 505 617 800 336 381 368 405 506 550 293 388 374 409 454 520 298 310 397 366 412 441 282 331 346 323 352 378 308 282 303 314 292 331 308 289 306 293 299 260 262 279 300 294 286 256 275 326 281 264 243 205 261 272 271 238 232 170 266 249 272 234 194 111 274 241 242 219 191 96 285 246 230 226 171 70 283 280 235 180 136 55 283 268 215 190 126 49 254 246 211 200 108 30 267 237 204 168 114 27 255 230 178 162 120 18 263 251 211 167 98 17 255 225 189 155 62 11 251 227 195 126 86 259 227 176 128 77 244 184 186 169 63 243 187 180 118 59 225 178 166 128 72 259 199 151 113 68 213 220 177 127 59 242 203 172 115 68 256 195 171 127 60 267 205 140 131 59 10000 10000 10000 10000 10000 10000 10000 10000 10000 10000 10000 10000 Ane 15 255 279 10 261 15 298 274 20 25 287 30 257 35 299 275 40 299 45 242 50 280 55 60 272 65 288 70 250 75 283 80 273 85 287 90 235 303 95 100 292 105 279 110 283 115 261 120 311 125 276 130 266 135 283 140 286 145 305 150 251 155 293 160 253 165 254 170 298 175 312 Total 10000 275 10000 10000 All 87746 32.50 38474 14.25 21265 7.88 12195 4.52 8875 3.29 8189 3.03 6893 2.55 5883 2.18 5593 2.07 5285 1.96 1.68 4535 4005 1.48 3827 1.42 3666 1.36 1.29 3483 3321 1.23 3022 1.12 2888 1.07 2778 1.03 2815 1.04 2620 0.97 2571 0.95 2448 0.91 0.87 2346 2321 0.86 2239 0.83 2246 0.83 2221 0.82 2138 0.79 2102 0.78 1895 0.70 2103 0.78 1952 0.72 2008 0.74 2034 0.75 2018 0.75 270000 100.00 9/10/96 41 RTI [PAGE 51] In Figure the percentages of impacts in sectors from to 180° have been plotted for Atlas IIAS random-attitude turns out to 280 seconds It should be remembered that random-attitude turns are representative of combined random-attitude and slow turns For 1000 theoretical Mode-5 impact percentages are also plotted in the figure for best-fit values of A obtained by trial and error 100 At,as·!!~r A~-l~~e··F~Hur~~:r~~~~~.i -···········i····················!·········Br-eakup·Qtalpha·ifldeg-i,b/ft·········+ L=J g.ggf up I II I I a 5,00 i o•-••o-n•o-nn-nn in-••••-••.,•-••••- n~•-un-uu-uu-HH...j.U~-- -oH-HH-•••n-in~•-••••-••••-••••-••o-,,o•ii-•u•-u••-••--- j.....·•••-••••-••••-••••---r sL··1···066 i i t=::t:::~:~:j I r•OUU L•••u A 3·.20 i uuou A=3.45 i i i I OHH•HH rHHUOOOH•U•OOOO a ur•············••u••r••u n•nHr•············----- r············••ooo ooo,nUOH>>THO HoH•••Hr uoOoO OOOOHOfHH••••••••••n r·i i I I I 20 40 60 80 100 120 140 160 180 Angle From Flight Path deg Figure Atlas IIAS Simulation Results with 1,000 By observing curve shapes it an perhaps be seen that no single value of A causes a theoretical impact distribution and a distribution of impacts from random-attitude turns to match closely over the entire range of sectors Attempts to improve the match on one end of the curve by selecting a different A merely degrades the match on 9/10/96 42 RTI [PAGE 52] the other end It is possible however to obtain fairly close agreement over sectors from ±80° to ±180° as seen in Figure Since for Atlas HAS there are few if any significant population centers in the launch area outside these sectors i.e within ±80° of the flight line failure of the curves to match closely near the flight line is of little consequence If a better data match is considered desirable for computing risks to population centers within ±80° of the flight line e.g ships either a different A can be selected for use with 1,000 or other values of A and can be derived If only a single value of is used no matter what the value a good match between theoretical and simulated data is not possible over the entire 180° sector for various breakup qa.'s Before becoming too concerned about lack of a data match between and 80° it should be remembered that many types of Mode-5 responses cannot be simulated so that the malfunction-tum impact distributions plotted in Figure are only a subset of all possible Mode-5 impacts Based on twelve Mode-5 failure responses for which impact data are available it is believed that inclusion of the non-simulatable Mode-5 responses would considerably improve the match in the sector from ±10° to ±80° Another mitigating factor is that risks near the flight line are totally dominated by Mode-4 failure responses To see how data matching is affected by selecting widely differing values of the theoretical Mode-5 impact distributions were computed for 50,000 100,000 500,000 and 5,000,000 Best-fit values for A were again determined by trial and error Results are shown in Figure 10 through Figure 13 along with the same impact distributions for random-attitude turns plotted in Figure For other values of and qa close agreement is possible from ±60° to ±180° 9/10/96 43 RT [PAGE 53] 100 AtJas.::HA$.::Rao.d9.m:A..Jud.e.::E~i1u.re.s.jhrougJJ:2:8.0::~c t:::::::::::::::::l::::::::::::::::::::l::~~!?~~P.P:9:~!i?.ry~:~~:::~:~9:~!~::::::::::::::::::I i···················l····················I··················-- 1·····~0,~toakup.r I i 10,000 10 i i I I t:::::::::::::::::::i:::::::::::::::::::t:::::::::::::::::::t:::::::::::::::::::t:::::::::::::::::::i::::::::::::::::::j -r-··r······r··············~~i~~•r r·················r··················1··················r·············_+ A 4.10 LO i i A 4~50 r················-r-············--r-··A·=r4·;7s- 55 i i i i I i i i i i o.outt HHn•~••••••••••••••••••Hj••••••••••••••••••••~u••••Hu•n l:::::::::::::::::::t:::::::::::::::::J U>UHoou•••••.l••••uun•••••••••L••HoOtU -~q"'&-Q i --~~H•~•H i••••uu i•••••••ouu I I I 20 40 60 80 100 120 140 160 180 Angle From Flight Path deg Figure 10 Atlas HAS Simulation Results with 50,000 9/10/96 44 RTI [PAGE 54] 100 Ars·HA~··Ra°4°m~A tude··F~Hures·rhrotJg:;::·28:·:src:--·--- greakup·q-atpha·jn·deg:..Jb/ff·-------t················-- i i na··~:t~:~~~P:l 20 000 i o·,L.1·0 ooo-- I I al 5000 I 10 uo H••••uuauuunf u•OU••---- fi 1,ooiooo········l en l--_-..:::-..:±-.==:\-k-l~~=t::..~d:=!~~::.::--+--l---+-----l 1--.J-\,~~~~t:~L o•i uuuou•••••••••-i••••••••••••u uoufu ni•••••••nnnnn•o I I a.o•o--HUUOOOWH 0.1 20 40 60 80 100 120 140 160 180 Angle From Flight Path deg Figure 11 Atlas IIAS Simulation Results with 100,000 9/10/96 45 RTI [PAGE 55] 100 as·HA$··Randpm A tttde Ft,itures·~hroug 280·:sec i i i-············er-eakt1p q..afpha.in-.degj,,lbtft j····················j 1'no br~akup g;ggg··••m- i i i a s,oob i i i m••·········:+:·:::::::::::::::$::;;;::50q~ooo -r~:··t~#i r··-·'t i A}·5.55·······-··············- I a i --•--u••····••n uuuuuoui,oo uuutnuu•••••unH 0.1 20 40 60 80 100 120 140 160 180 Angle From Flight Path deg Figure 12 Atlas IIAS Simulation Results with ff 500,000 9/10/96 46 RTI [PAGE 56] 100 Atlas·ffA:S··Random~Attftt.tde··Fattures·~hrot:1g 280··s,ec- 1···················:·········sr.eaI<uP::qJa1pna.h~:ae 16Jtt~- i akup 10,000 i i a soob i 10 i--------....-'ik-- i 20 40 60 80 100 120 140 160 180 Angle From Flight Path deg Figure 13 Atlas IIAS Simulation Results with 5,000,000 9/10/96 47 RTI [PAGE 57] The five values of and the corresponding best-fit values of A used to compute the Mode-5 distributions shown in Figure through Figure 13 are tabulated in Table 20 It is apparent that the value of A is dependent on both qcx and In general if a larger value of is selected a larger value of A is required to effect a fit with the random- attitude-tum data On the other hand if the breakup qcx is increased the required value of A must be decreased Only qcx is critical since as shown later any value of together with its corresponding value of A can be used in the launch-area risk computations if significant targets do not lie within ±80° of the flight line Table 20 Shaping Constants for Atlas IIAS Breakup qcx deg-lb/ft2 A none 1,000 1.90 20,000 2.75 14,000 3.00 10,000 3.20 5,000 3.45 none 50,000 3.15 20,000 4.10 10,000 4.50 5,000 4.75 none 100,000 3.40 20,000 4.30 10,000 4.75 5,000 5.00 none 500,000 4.00 20,000 4.85 10,000 5.30 5,000 5.55 none 5,000,000 4.75 20,000 5.65 10,000 6.10 5,000 6.30 interpolated 9/10/96 48 RTI [PAGE 58] Because of the uncertainties in breakup conditions the values of A for each in Table 20 have been plotted against qa in Figure 14 By reading from the plots a value of A for the five values of can be obtained for any breakup qa deemed appropriate between 5,000 and 20,000 deg-lb/ft2 6.5 6.0 5.5 5.0 -ffl 4.5 4.0 3.5 3.0 2.5 r················..l.B 5,000,000 I ---------------r----------------i I ----.l._B 500,000 i is oo,odo -r-:-:-~-t----- 13 50,000 -··i·························i I I I I i•H•---~iHH-- i••••u uu•u 1,000 I I i i i I 5000 10000 15000 20000 25000 Breakup q-alpha deg-lb/ft Figure 14 Effects of Breakup q-alpha on A for Atlas HAS 6.2.2 Launch-Area Mode-5 Risks The twenty sets of A and shown in Table 20 were used to compute Mode-5 launch- area risks for population centers inside the impact limit lines for an Atlas HAS daytime launch of a Telstar-4 payload from Pad 36A Results of these and two other cases are given in Table 21 The Mode-5 Ee in the first line old baseline case of Table 21 is presented for comparison only It was obtained from data in the first line of Table 45 of an earlier RTI study 131 In Ref the total Atlas IIAS failure probability for the first two minutes of flight was set at 0.04 with the probability of a Mode-5 failure response assumed to be 0.005 The second line in Table 21 shows the result of a recomputation of the Mode-5 baseline risks again with 1000 and A using newly derived values for the total failure probability and for a Mode-5 failure response For flight phases a total failure probability of 0.031 was assumed as extracted from Table for 9/10/96 49 RTI [PAGE 59] 0.98 The conditional probability of a Mode-5 response was assumed to be 0.08 from the last line of Table 15 so the absolute probability was 0.031 0.08 0.0025 For the remaining cases in Table 21 the same assumptions were made for the total failure probability and for the probability of a Mode-5 response a:,mg Table 21 Sh Constants an eae Ri sks or Atlas HAS Ps TB sec Breakup qa deg-lb/ft2 A Mode-5 Ee 10-6 0.005 118 14,000 1,000 baseline 3.00 227 0.0025 280 14,000 1,000 3.00 49.1 new 0.0025 280 none 1,000 1.90 139.8 20,000 2.75 73.7 10,000 3.20 33.4 5,000 3.45 19.8 0.0025 280 none 50,000 3.15 144;9 20,000 4.10 75.6 10,000 4.50 37.1 5,000 4.75 21.8 0.0025 280 none 100,000 3.40 144.8 20,000 4.30 79.8 10,000 4.75 36.1 5,000 5.00 21.1 0.0025 280 none 500,000 4.00 143.6 20,000 4.85 79.9 10,000 5.30 35.9 5,000 5.55 20.8 0.0025 280 none 5,000,000 4.75 144.8 20,000 5.65 77.7 10,000 6.10 34.2 5,000 6.30 22.0 Interpolated from Figure 14 As seen from Table 21 the Mode-5 risks are highly dependent on A and insensitive to the value chosen for provided a proper choice is made for A Even for values of as different as 1,000 and 5,000,000 the Mode-5 risks qa 5,000 differ by only 12% This difference drops for all other values of In fact the differences probably have more to do with the choice of A than to any inherent difference in results due to the choice of For Atlas IIAS 24% of the total Mode-5 Ee in the launch area is due to one population center and 51 of the total Ee to only five population centers see page 49 of Ref If values of A had been chosen so that theoretical distributions and random-attitude-turn distributions more nearly matched for the radial directions to these population centers 9/10/96 50 RTI [PAGE 60] the differences in calculated Mode-5 risks for the different values of would surely have been less Further understanding of why small differences in Ee exist can be gained by plotting values of the Mode-5 density function computed from Eq This has been done in Figure 15 for a range of three miles using values of A and from Table 21 for qa 5,000 deg-lb/ft2 Since Eq does not include a factor to account for the probability of a Mode-5 failure the values plotted in the figure are conditional impact probabilities per square mile For the sector from 120° to 180° which is where most population centers are located the density-function value for 5,000,000 is largest and for 1,000 is smallest Results consistent with this are shown in Table 21 where the largest and smallest Ec's are for 5,000,000 and 1,000 respectively 00 00 1001~1~100100 Theta deg Figure 15 Mode-5 Density-Function Values at Three Miles 6.2.3 Effects of Mode-5 Constants on Ship-Hit Contours In the preceding section certain values were assigned to Band by trial and error best- fit values of A were found For every breakup qa and every it was possible to find a value of A that produced good agreement between theoretical and simulated impact data over sectors from ±100° to ±180° see Figure 10 through Figure 13 In some 9/10/96 51 RTI [PAGE 61] cases the agreement gradually deteriorated for angles below ±100° while in other cases agreement was remarkably good to ±40° Below this agreement was generally poor except in a region between and where the theoretical and simulated curves crossed As pointed out previously for Atlas pad locations at the Cape essentially all significant population centers except ships are located in the sectors from ±100° to ±180° Thus any with the corresponding best-fit value of A can be used to compute launch-area risks irrespective of the assumed breakup qa In unusual cases at the Cape or at other launch locations population centers may be located outside sectors of good agreement for some B's If such situations arise a value of should be used in the risk calculations that produces the best fit over the largest sector possible generally ±40° to ±180° The values of producing this result are listed in Table 22 as functions of breakup conditions Table 22 Best-Fit Conditions for Atlas HAS Breakup Conditions A none 50,000 3.15 20,000 100,000 4.30 10,000 100,000 4.75 5,000 5,000,000 6.30 Although the selected values of A produce poor agreement in the sectors from to ±40° this does not mean that good agreement in this region is impossible Instead it means that the value of A required to produce good agreement in the ±40° sectors will produce poor agreement elsewhere In special situations where the only population centers of interest are within ±40° of the flight line other values of A can be derived for use in the risk calculations From a practical standpoint the effort required to find a value of A that produces a better fit within ±40° or so of the flight line is unnecessary Within this sector the Mode-4 failure response which is almost 11 times more likely to occur than a Mode-5 response totally dominates the computed risks As verification the DAMP program was run for the Atlas IIAS vehicle and ship-hit contours plotted for three vastly different pairs of A's and B's The results are shown in Figure 16 through Figure 21 where the total failure probability during the first two minutes of flight was assumed to be 0.04 and the probabilities of Mode-4 and Mode-5 responses were 0.033 and 0.005 respectively For each A and ship-hit contours were computed for Mode alone and then for all response modes As expected some downrange extension occurred in the Mode-5 contours as the value of A was increased since the higher the value of A the more concentrated impacts are near the flight line When all response modes were included in the calculations contour differences were almost imperceptible showing the total dominance of Mode If the calculations were remade with a Mode-4 9/10/96 52 RTI [PAGE 62] response 10.9 instead of 6.6 0.033 0.005 6.6 times as likely as a Mode-5 response the differences in contours would be even less 15 Atla UAS 10- Modt -----110 i I I ciS it II I a 1,:000 A 3.00 I I i -15 10 15 20 25 Downrange Distance nm Figure 16 Atlas IIAS Mode-5 Ship-Hit Contours with A 3.00 From Table 15 86.2 7.9 10.9 9/10/96 53 RTI [PAGE 63] 10 15 20 25 Downrange Distance nm Figure 17 Atlas HAS All-Mode Ship-Hit Contours with A 3.00 RTI 9/10/96 54 [PAGE 64] en en 15 I Atla IIAS -110-6 Modr pl 10 10 I I I I i -10 I I i i B=1~boo i A 3.~5 -15 i i i i i 10 15 20 25 Downrange Distance nm Figure 18 Atlas HAS Mode-5 Ship-Hit Contours with A 3.45 9/10/96 55 RTI [PAGE 65] 15 --!10◄ I Atlas IIAS I i All ode I 10-6 i I -'·········-----.10········_1 ----i,-------+-------r-------r----- i ca i i i t----i---~--- I i i i r-----r----- -10 I i 1,000 i i i A 3.45 i i i I i I -15 10 15 20 25 Downrange Distance nm Figure 19 Atlas HAS AU-Mode Ship-Hit Contours with A 3.45 9/10/96 56 RTI [PAGE 66] -15 10 15 20 25 Downrange Distance nm Figure 20 Atlas IIAS Mode-5 Ship-Hit Contours with A 6.30 9/10/96 57 RTI [PAGE 67] 15 10 Atla IIAS All f\1ode 10-6 10 I I I I i CCI i i i i i i o!s -1:.~:-:i=-==~-l~:-~~1.::::.i I I I I -10 5,000,00Q A 6.30 -15 i i 10 15 20 25 Downrange Distance nm Figure 21 Atlas HAS All-Mode Ship-Hit Contours with A 6.30 6.2.4 Range Distributions of Theoretical and Simulated Impacts Earlier discussions had to do with how well the angular part of the Mode-5 impact density function could be made to agree with angular data derived from simulated random-attitude turns A similar procedure was used to- test agreement between the range part of the Mode-5 impact density function and the simulated data For this purpose beginning at 15 seconds random-attitude turns were made at 2-second -intervals out to 279 seconds assuming no breakup and breakup qcx:'s of 5,000 and 20,000 deg-lb/ft2 At each time 2,000 trajectories and impact points were computed giving a total sample of 266,000 for each breakup condition For each impact point the range from the pad was computed and the total number of impacts calculated in 10 mile range intervals out to 350 miles Impacts beyond this range were placed in a single range category The percentage of impacts in each range interval was then computed and plotted as shown in Figure 22 9/10/96 58 RTI [PAGE 68] 100 Cl a 0.1 E=E.Al'r ASJ Theoretical Br~akup q~alphal 5.,.opo de9,::lb/ft Br~akup q-alpha 20,opo degrlb/ft i NniBreaku i i i i uooo uooo I oo oo•HHHO r·················r··················t I I I I I I 50 100 150 200 250 300 350 Impact Range nm Figure 22 Impact-Range Distributions Theoretical impact percentages for the same 10-mile range intervals were obtained by integrating the Mode-5 impact-density function Eq between the angle limits of zero and and between the range limits of and and doubling the results The percentages are plotted in Figure 22 As pointed out in more detail at the end of Appendix the percentage of impacts in any range interval is independent of the values of A and Figure 22 shows that the range impact distributions for theoretical Mode-5 impacts and random-attitude failures for breakup qa.'s between 5,000 and 20,000 deg-lb/ft2 are in excellent agreement out to 50 miles Theoretical percentages and random-attitude percentages for qa 5,000 deg-lb ft2 considered to be the most realistic value are in good agreement out to 190 miles Beyond that the differences appear fairly large magnified as they are by the logarithmic scale although the maximum absolute difference is only 0.4% The steep rise in all curves at 350 miles is artificially created by lumping all impacts beyond 350 miles into one range interval instead of 10-mile intervals 9/10/96 59 RTI [PAGE 69] 6.3 Shaping Constants for Delta-GEM Although less extensive the computations made and graphs plotted to establish Mode- shaping constants for Delta parallel those described in Section 6.2 for Atlas HAS The approach may be summarized as follows Calculate impact points from 10,000 simulated random-attitude turns made at 10 second intervals from programming time at seconds until staging at 270 seconds 260,000 simulations total The impact points from these turns which produce impact results similar to slow turns are assumed to be representative of the totality of Mode-5 impacts Determine the percentages of impacts in sectors from to 180° For assumed values of A and compute the percentages of impacts in the same sectors from the theoretical Mode-5 impact-densityiunction By trial and error find values of A and that provide a best fit between the simulated and theoretical impact data 9/10/96 60 RTI [PAGE 70] 6.3.1 Optimum Mode-5 Shaping Constants The percentage of Delta vehicles that break up during simulated random-attitude turns are plotted against failure time in Figure 23 The same breakup qa's used in the Atlas IIAS calculations were used here It can be seen from the figure that over 50% of the vehicles break up either immediately or eventually if a turn begins between about 10 and 115 seconds 100 90 80 70 60 50 a a I 40 ffl 30 cc 20 10 i Delta-GEM --f···················+····················f i i i i i i q-alpha in deg-lb/tt r······-r··················t r-·················-r-·----t i i q-alptla 5,000 I I -~~~ci I i i i I i i i i I I I l~\j i i i i i i i i f····················f····················f 40 80 120 160 200 240 280 Failure Time sec Figure 23 Delta-GEM Breakup Percentages 9/10/96 61 RTI [PAGE 71] Figure 24 shows the percentages of malfunction-turn impacts in sectors for no breakup and for breakup qa's of 20,000 10,000 and 5,000 deg-lb/ft2 For 1,000 theoretical Mode-5 impacts are also plotted using best-fit values of A This value of was chosen since it is currently used by-RTI in making launch-area risk studies for the 45th Space Wing In the sectors from ±80° to ±180° where most of the population centers are located fairly good data fits were possible for all breakup qa's except 5,000 deg-lb/ft2 No value of A could be found to produce a good fit with 1,000 The bottom plot in Figure 25 shows that an excellent fit between malfunction-turn and theoretical data is possible for qa 5,000 deg-lb/ft2 if a different choice of Bis made a 0.1 i i i i l····················l 0.01 20 40 60 80 100 120 140 160 180 Angle From Flight Path deg Figure 24 Delta-GEM Simulation Results with 1,000 9/10/96 62 RTI [PAGE 72] The simulated impact percentages plotted in Figure 25 are identical with those shown in Figure 24 The theoretical percentages in Figure 25 were obtained by trying various combinations of and A until the best possible fit was obtained in the sectors from ±60° to ±180° From these plots it seems apparent that a reasonable fit between malfunction- turn and theoretical Mode-5 impact data can be found for any qa between 5,000 and 20,000 deg-lb/ft2 I ts onnt i••••ono oh;••••••••••hU O:::i IS ooooooOoOoo 00000 0000 uoo i a 0.1 n,nnnn•••••--•1/nnooonooooonn uuoou nu i i i i i i 0.01 20 40 60 80 100 120 140 160 180 Angle From Flight Path deg Figure 25 Delta-GEM Simulation Results with Best-Fit Shaping Constants 9/10/96 63 RTI [PAGE 73] 6.3.2 Launch-Area Mode-5 Risks Using values of A and from Figure 24 and Figure 25 program DAMP was run to compute Mode-5 launch-area risks for population centers inside the impact limit lines for a Delta-GEM/GPS-10 daytime launch from Pad 17A Results from these and two other cases are shown in Table 23 The Mode-5 Ee in the first line old baseline case is presented for comparison It was obtained from the first line of Table 55 of an- earlier RTI study3 In that study the total Delta failure probability during the first 130 seconds of flight was set at 0.02 with the probability of a Mode-5 response assumed to be 0.0025 The second line in Table 23 shows the result of a recomputation of the Mode- risks again with 1,000 and A using failure probabilities derived earlier in this report From Table and Table 15 the failure probability during flight phases is 0.013 and the relative frequency of occurrence of a Mode-5 response is 0.08 The absolute probability of a Mode-5 response thus becomes 0.013 0.08 0.001 Table 23 Shaping Constants and Related Risks for Delta-GEM TB Breakupqa Mode-5 Ee Ps sec deg-lb/ft A 104 0.0025 130 12,000 1,000 3.00 394 baseline 0.001 270 12,000 1,000 3.00 88.8 newp,&T 0.001 270 none 1,000 1.90 220.0 20,000 2.90 104.4 10,000 3.10 74.1 5,000 4.30 5.2 0.001 270 none 10,000 2.60 224.4 20,000 2,000 3.15 102.4 10,000 2,000 3.35 72.0 5,000 3.50 5.1 Interpolated from data contained in Figure 24 As in the case of Atlas Table 23 again shows that the risks in the launch area are highly dependent on qa and thus on A but relatively insensitive to changes in if a proper value is selected for A For example if qa 10,000 the computed risks for 1,000 A 3.10 and 2,000 A 3.35 differ by-less than For the no-breakup cases where 1,000 and then 10,000 the computed risks in the launch area differ by less than2% Launch-area risks are highly dependent on the vehicle's capability to withstand aerodynamic forces Except early in flight low-strength vehicles generally break up quickly after a malfunction turn begins The later such turns occur the more likely pieces are to impact downrange of the launch point thus lessening risks to uprange populations The effects of vehicle strength on risk are clearly seen in Table 23 where 9/10/96 64 RT [PAGE 74] for example the risks are over 20 times as great if the vehicle's breakup qa is 20,000 rather than 5,000 deg-lb/ft2 6.4 Shaping Constants for Titan IV Mode-5 shaping constants for Titan IV were developed as described in Section 6.3 for Delta except that a total of 290,000 simulations were run between the programming time of 18 seconds and staging at 300 seconds The percentage of vehicles that break up during simulated random-attitude turns are plotted against failure time in Figure 26 The same qa's used with Atlas and Delta were used here and similar breakup results were obtained 100 90 80 70 60 a 50 a 40 Ill 30 20 10 n•u i nHHf i i Titan IV i i I i i i i i I i i ii-alpha iin deg-lb/ft i t,·t i I i i I q-alpha 000 i i -:i:··:::··c:Falpn·a·;;;·tn;ooo-···f I --r--g-alpha.=.~loo i i i i i i i nn nn+ nnH•••••••j 40 80 120 160 200 240 280 Failure Time sec Figure 26 Titan IV Breakup Percentages 9/10/96 65 RTI [PAGE 75] Figure 27 shows the percentages of malfunction-tum impacts in sectors for no breakup and for breakup qa's of 20,000 10,000 and 5,000 deg-lb/ft2 For 1,000 theoretical Mode-5 impact distributions are also plotted in the figure using best-fit values of A This value of was chosen since it is currently used by RTI in making launch-area risk studies for 45 SW SE Within the sectors from ±60° to ±180° where most population centers are located data fits are reasonably good As seen in the next figure the divergence for the no-breakup case can be greatly reduced by-selecting other values for and A 100 T:i an:::IV andoqi:::.Attitu~e::P.aitpr.es::tbrougb nn u•onJ•n•••••••non l····················f 00:se:q i Breakun··rr.::atnhra··rn··den.::lbfft···r l':-:'j i J~akf i=:==i••:•::::t I I I gjgg I I I I 10 ------------~-i----i----------i-- i:::::::::::::::::::i::::::::::::::::::::t 1,000.:::::::::1 A 2.aot t:::::::::::::+=:::::::f i i i HHHUH~H·nn••!•n•••••uu unu•{••••••n~~••••••••u~nnn•••••n•n r:::::::::::::::I a i H&UHj uu•nnon onuunn f···················l-···················l I I ouo•••••nn•••~•••••nnn uuu••u i i 0.1 i i u'•••••••HHO•,.•••••'•n••••"'u t••u nu•••••••••?,.•••••••on•••••••i•unu i nlnuo•,.-----••--~•-- uu~H•o••H u,un•nn uu u••••n••:•n"•••-- u,nn noo u,,uH,UUH J•uu HdU 00 i,n,ooooOOooOOo I 20 40 60 80 100 120 140 160 180 Angle From Flight Path deg Figure 27 Titan Simulation Results with 1,000 9/10/96 66 RTI [PAGE 76] The simulated impact distributions plotted in Figure 28 are identical to those shown in Figure 27 The theoretical Mode-5 percentages were obtained by testing various combinations of and A until a good fit between the simulated malfunction-turn results and theoretical impact-distribution data was obtained in the sectors from ±60° to ±180° Although somewhat better fits may be possible for the lower breakup qa's the effort to find them did not seem worthwhile since the A's and B's shown in the figure produced fits that were more than adequate in the sectors where the population centers are located 100 Titan::l:V::Randor:h-:=Attitude::Eaitures:thtough:::300:serl I +eaku~~m~t:;~tlb/lt i 20!000 i i i 10j000 I i i i II siooo i I i I 10 1::::::::::::::::::J:::::::::::::A a~~=Ja~ooo:~c 3.15,-·B··-2 00O···-+ Cl l_::::=_=J~~:~H:gggf LC I I I s~~~=t i --t···················1····················i a I I 0.1 I --·········••i••·······································~·················••-i i i i i -r············--···--r------ 20 40 60 80 100 120 140 160 180 Angle From Flight Path deg Figure 28 Titan Simulation Results with Best-Fit Shaping Constants 9/10/96 67 RTI [PAGE 77] The best-fit values of and A shown in Figure 27 and Figure 28 are tabulated for convenient reference in-Table 24 For breakup qa's of 10,000 and 5,000 deg-lb/ft2 the currently-used value of 1,000 provided a better data fit than other values of that were investigated Table 24 Shaping Constants for Titan IV TB sec Breakupqa deg-lb ft2 A II 300 none 20,000 10,000 5,000 1,000 2.00 2.95 3.25 3.50 300 none 20,000 10,000 5,000 10,000 2,000 1,000 1,000 2.70 3.15 3.25 3.50 Risk calculations in the launch area were not made for Titan IV 9/10/96 68 RTI [PAGE 78] 6.5 Shaping Constants for LLV1 Shaping constants for LL Vl were developed as described in Section 6.3 for Delta except that a total of 290,000 simulations were made between the programming time of second and staging at 290 seconds The percentages of vehicles that break up during simulated random-attitude turns are plotted in Figure 29 As expected the results are similar to those shown previously for Atlas Delta and Titan although due to its higher acceleration the rapid drop-off from near 100% breakup occurs at an earlier time for the LL Vl than for the other vehicles 100 90 80 70 60 Lo 50 I a a 40 30 CD 20 10 I LLV11 i -}••••mum•m i q-~lpha in eg-lb!f i i i g~g q:-alpha 20,00P I I i 40 80 120 160 200 240 280 Failure Time sec Figure 29 LL Vl Breakup Percentages 9/10/96 69 RTI [PAGE 79] Figure 30 shows the percentage of malfunction-tum impacts in sectors for no breakup and for breakup qa.'s of 20,000 10,000 and 5,000 deg-lb/ft The three breakup qa's produced impact distributions that were surprisingly similar possibly due to the vehicle's higher acceleration Theoretical Mode-5 impact distributions are also plotted in the figure for 1,000 and best-fit values of A This value of was chosen since it is currently used by-RTI in making launch-area risk studies for 45 SW SE For all except the no-breakup case values of A were found that produced good fits between the malfunction-tum and Mode-5 impact distributions in the sectors from ±60° to ±180° 100 i i::+=--=--·=·····:::::r i i v1:::R~~~;;,~J~!¥.!~;:f1~!!~r-,s::thf.o:l¥.9.~:~..!~~~::::::I Sr.eakyp.q..alp~a i11 dikrlb/.fd g~a.Rf I i 10:,000 10 ---~-.~85-.~.,- 1---7 A,-2.75 I m••••1:::::::::••••~:;:-=...J- i i=:::::··l a I --U::-::::.......,:::1i--::::-::::-:::::-::::--l:::!-::::-::::-::::-:::::-;:::r-::::-::::-::::-::::--I 0.1 -··•••-••••----+-t••-,>,>,o,0-,0,0~~--H--H•O;+- H•n hU i u••n Ha:a unonn>•h UHHH o.eHOeH ouHOHo HH F=T-=::::J=l"=:::::I i 0.01 20 40 60 80 100 120 140 160 180 Angle From Flight Path deg Figure 30 LL Vl Simulation Results with 1,000 9/10/96 70 RTI [PAGE 80] Figure 31 shows that a good fit for the no-breakup case is possible if higher values of and A are used The simulated malfunction-tum impact distributions for the breakup cases plotted in this figure are identical with those in Figure 30 Since the theoretical percentages for 1,000 produced excellent fits these values were simply replotted in Figure 31 For the no-breakup case various combinations of Band A were tried before arriving at the plot shown in the figure 100 i==:::::::i==:::::::::i:=====r.===:::::r:::::::::::::::::::::r::::::::::::==r.:==:::::::r.::===:::::::::r:::==:::::::i t·ttv 4···R,.,-""·,t;,.n>\"···A•tt C'l"i't is··•k·;,;•;;;(1~k··~n s;,<;;o ttf-t I uc 1.~•s:.~••~~~•~l::l~~•=~-- i cr.eakup alpna in.deg lb/ft.1 i:iglgg1-···l··--····1······-r 10 i i:a.- fx im i~j I ±!:i~i~6 A.--2.70,B)-.1,000 I A -75 Br 1,ooq n••nuolo i••••••••••.•••••••••i••n I i Houu•n••H•••i••HHH>•••~U•& -J-n•••n•-•n•noo).••••ouu•uuaH uu6&&HUHH•n,Cou•••••••••••••••••f u•H HH t•••oH•H f•••••••••••n -+uH +••••uuu Omu I t:~~~::::::::::::::t::::~::::::::::::::t m••••••••mm mh i n•••••Uuu••t•••uuuu ol -••••••••H•n n••••••••on•f uu i i i I i i i 0.01 20 40 60 80 100 120 140 160 180 Angle From Flight Path deg Figure 31 LL Vl Simulation Results with Best-Fit Shaping Constants 9/10/96 71 RTI [PAGE 81] The best-fit values of and A from Figure 30 and Figure 31 have been listed for convenient reference in Table 25 It is interesting to note that for all breakup conditions the currently-used value of 1,000 provided a better data fit than any other that was investigated Table 25 Shaping Constants for LLVl TB Breakup qa sec deg-lb A 290 none 1,000 1.85 20,000 2.60 10,000 2.70 5,000 2.75 290 none 10,000 2.45 20,000 1,000 2.60 10,000 1,000 2.70 5,000 1,000 2.75 No launch-area risk calculations were made for LL Vl 6.6 Shaping Constants for Other Launch Vehicles Procedures for developing Mode-5 shaping constants A and are fully described in this report For Atlas Delta Titan and LL Vl best-fit values of A were derived for four breakup conditions for the currently-used value of 1,000 and for optimum-fit values of For any new launch vehicle requiring risk calculations the same procedures should be followed to obtain suitable values for A and As an alternative and less time-consuming process values of A and can be estimated by comparing the new vehicle with one of the four vehicles referred to above and listed in Table 26 If the configuration and trajectory of the new vehicle and one of the listed vehicles are similar values of A and shown in the table for that vehicle and the assumed breakup condition can be used There may of course be no similarity between the new vehicle and any of the listed vehicles In that event and depending on assumed breakup conditions one of the mean values shown in the last row of the table can be selected until better values can be developed Table 26 Summary of A Values for 1,000 Vehicle IP Range nm at 30 sec Breakup qa deg-lb ft2 5,000 10,000 20,000 None Atlas HAS Delta-GEM Titan IV CLVl 0.3 5.2 1.9 33.4 3.45 4.30 3.50 2.75 3.20 2.75 3.10 2.90 3.25 2.95 2.70 2.60 1.90 1.90 2.00 1.85 Other vehicles 3.5 3.1 2.8 1.9 9/10/96 72 RTI [PAGE 82] Potentlal Future Investigations Because of contract limitations on funds and the deadline for publishing the report certain interesting facets of the Mode-5 modeling process could not be fully investigated Several such issues are listed below in considered order of importance Effects on shaping constants A and of using more precise breakup qa conditions during malfunction-tum simulations Effects on shaping constants A and and thus overall risks if different values of TB are used in computing theoretical and simulated impacts e.g TB corresponding to burnout of zero first and second stages Effects on shaping constants A and if drag is accounted for in computing free- fall impact points after a malfunction tum Shaping constants could be determined for maximum minimum and intermediate ballistic coefficients then interpolated for other values This more accurate approach would ultimately require extensive modifications to DAMP Effects on shaping constants A and if sectors smaller than are used to compare theoretical and simulated impact data e.g or Effects on relative failure probabilities for solid-propellant vehicles if unclassified solid-propellant vehicles or declassified test results are used in the historical data samples e.g Pershing Polaris Poseidon Trident Other tasks that should be performed at some point in the future include a Update absolute failure probabilities for Atlas Delta Titan and perhaps other vehicles Develop suitable shaping constants A and for new vehicles In this regard see Section 6.6 9/10/96 73 RTI [PAGE 83] Summary In RTI's risk-computation program DAMP vehicle failures per se are not considered Instead each catastrophic failure is assumed to produce one of five failure responses and it is these response modes that are modeled in DAMP Although most catastrophic failures result in impacts near the flight line less likely malfunctions may cause debris to fall either uprange or well away from the flight line In DAMP vehicle failures with this potential are for the most part classified as Mode-5 failure responses The resulting impacts are modeled by a rather formidable-looking density function that includes two shaping constants A and that strongly influence the nature of the impact-density function To obtain absolute probabilities or risks the function must be multiplied by-a probability-of-occurrence factor The primary purpose of this study was to determine the best values for A and for various vehicle programs Other objectives not explicitly included in the statement of work were to develop absolute failure probabilities for Atlas Delta and Titan and to derive relative probabilities of occurrence for the five failure-response modes in DAMP Although some risk analyses may ignore unlikely failure-response modes Section demonstrates the need for a Mode-5 response or some similar response through brief descriptions of actual vehicle flights Section and Appendix provide the reader with a fuller understanding of the nature and intricacies of the Mode-5 impact- density function Together they show how density-function shaping is affected by values of A and and in particular how the Atlas IIAS launch-area risk contours change if the value of A is changed Section is a philosophical discussion of methods of assessing vehicle failure probability or reliability Two approaches are discussed one strictly empirical the other a parts-analysis method that involves the assignment of failure probabilities to individual parts components and systems Although difficulties exist with both approaches the empirical method was chosen to estimate both absolute and relative failure probabilities As the first step in estimating failure probabilities empirically performance histories were gathered summarized and tabulated Appendix by launch date for Atlas Delta and Titan vehicle launches from the Eastern and Western Ranges and for Thor launches from the Eastern Range Obtaining this information and assigning response modes and associated flight phases for each failure consumed a large portion of the effort expended on this task A filtering i.e data weighting technique was selected see Section 5.1 and Appendix and applied to the launch failure data to estimate overall failure probabilities by flight phase see Section D.1.3 for Atlas Delta and Titan vehicles The recommended failure probabilities are based on test results involving only those vehicle configurations that are considered to be representative of current launch 9/10/% 74 RTI [PAGE 84] configurations see Section D.1.4 The results summarized previously in Table of Section 5.1 are repeated here in Table 27 Flight phases go from liftoff through first-stage or booster cutoff while flight phase extends through second-stage or sustainer cutoff Although failure probabilities for all flight phases are listed in Table only malfunctions during flight phases through have significant effects on launch- area risks Table 27 Failure Probabilities for Atlas Delta and Titan Predicted Failure Probabili Vehicle Flight Phase Flight Phase Atlas Delta Titan 0.022 0.010 0.040 0.031 0.013 0.064 Absolute overall failure probabilities for Atlas Delta and Titan were based only on flight results from representative vehicle configurations Because of the small number of failures in the individual representative samples test results for all configurations including Thor were combined into a single sample and filtered to estimate relative failure probabilities for the five failure-response modes in program DAMP see Section 5.2 The results for flight phases and together with recommended values for new launch systems were summarized in Table 15 and Table 16 respectively and are repeated here in Table 28 and Table 29 Table 28 Recommended Res onse-Mode Percenta es for Fli ht Phases Response Mature Launch New Solid Systems New Liquid Systems Mode stems 0.993 0.996 0.999 0.4 2.2 7.4 5.4 4.3 2.3 0.1 0.4 1.7 86.2 80.4 73.3 7.9 12.7 15.3 Table 29 Recommended Res Response Mode Mature Launch stems 0.993 0.5 7.4 0.1 81.9 10.1 New Solid Systems New Liquid Systems 0.996 0.999 3.4 10.7 6.6 4.3 0.6 2.4 74.5 67.0 14.9 15.6 For Atlas Delta and Titan absolute probabilities for the individual response modes were obtained by multiplying absolute failure probabilities from Table 27 by the relative probabilities shown in the second columns of Table 28 and Table 29 The results presented originally in Table 17 are repeated below in Table 30 To obtain 9/10/96 75 RTI [PAGE 85] these results the relative probabilities used were more precise than those given in Table 28 and Table 29 No pretense is made that all figures in Table 30 are actually significant Table 30 Absolute Failure Probabilities for Response Modes Vehicle Atlas Delta 0-1 0-2 0-270 sec 0-630 sec Titan 0-1 0-2 0-300 sec 0-540 sec Flight Phase 0-1 0-170 sec 0-2 0-280 sec Model 0.000119 0.000121 0.000054 0.000051 0.000216 0.000250 0.003437 Mode2 Mode3 0.001637 0.000011 0.001665 0.000744 0.000698 0.002976 0.000012 0.000005 0.000005 0.000020 0.000026 Mode4 0.018007 0.026738 0.008185 0.011212 0.001012 0.001034 0.032740 0.004048 0.055200 0.005088 Mode5 0.002226 0.002465 Total 0.022 0.031 0.010 0.013 nn11n 0.064 The same chronological composite sample used to estimate relative failure probabilities for the failure-response modes was used to estimate the conditional probability that a Mode-3 or Mode-4 response terminates with a rapid tumble This was found to be about one-third see Section 5.3 Because the empirical data were insufficient to determine Mode-5 density-function shaping constants A and an alternate approach was used Basically for each of four vehicles Atlas Delta Titan and LL Vl Mode-5 failure responses were simulated at a series of failure times The simulated malfunctions investigated were random-attitude turns and slow turns At each time 10,000 impact points were computed The percentages of impacts in sectors from downrange to 180° uprange were determined These were compared with the percentages obtained in the same sectors from the theoretical Mode-5 impact-density function when specific values were assigned to A and By trial and error values of A and producing a good match between the two sets of percentages were established see Section After best-fit values were determined the impact percentages for Atlas HAS in 10-mile range increments were checked to verify that the range part of the Mode-5 impact-density function was consistent with impact ranges resulting from 266,000 simulated Mode-5 failure responses see Section 6.2.4 Since the impact distributions resulting from simulated malfunction turns were highly dependent upon the dynamic pressure qa assumed to cause vehicle breakup shaping constants A and were likewise dependent on breakup assumptions Three breakup qa's and a no-breakup case were investigated by-simulating 270,000 malfunction turns for each of the four conditions Although a qa of 5,000 deg-lb/ft2 is considered most likely applicable for Atlas Delta and Titan shaping constants for all breakup conditions were provided earlier in Section 9/10/96 76 RTI [PAGE 86] Traditionally a value of 1,000 has been used by the 45 SW SE in ship-hit calculations and by RTI in performing launch-area risk analyses for the 45 SW SE Using this value of for each vehicle values of A were found that produced a good match between simulated and theoretical data The results for qa 5,000 10,000 and 20,000 deg-lb/ft2 are given in Table 31 As discussed earlier in the report no single value of A could be found that produced a good fit over the entire 180° sector although with one exception a good match did exist in the uprange portion of the sector from about ±90° to ±180° For launches from Cape Canaveral most population centers are located in this uprange sector For any launch-area population centers located in the downrange sector the risks are almost surely dominated by the Mode-4 failure response Table 31 Summary of A Values for 1,000 Flight TB Breakup qa deg-lb/ft2 Vehicle Phase sec 5,000 10,000 20,000 Atlas HAS 0-2 280 3.45 3.20 2.75 Delta-GEM 0-1 270 4.30 3.10 2.90 Titan IV 0-1 300 3.50 3.25 2.95 LLVl 0-2 290 2.75 2.70 2.60 Other vehicles 3.5 3.1 2.8 Other values of were investigated to find combinations of and A that provided the best possible data fits over the largest possible portion of the to 180° sector Although no combinations of A and could be found that produced good fits for the entire 180° sector the values shown in Table 32 extended the fit from the uprange direction to within about 40° of the downrange direction Table 32 Summary of Optimum Mode-5 Shaping Constants Flight TB Breakupqa Vehicle Phase sec deg-lb ft A Atlas 0-2 280 5,000 5,000,000 6.30 Delta 0-1 270 5,000 3.50 Titan 0-1 300 5,000 1,000 3.50 LLVl 0-2 290 5,000 1,000 2.75 Launch-area risk calculations were made for Atlas and Delta to ascertain the effects of using radically different values of A and Bin the Mode-5 impact-density function For example for a breakup qa of 5,000 deg-lb/ft2 values of A 3.45 and 1,000 from Table 31 and A 6.30 and 5,000,000 from Table 32 were used to determine total Mode-5 launch-area risks for an Atlas HAS launch from Complex 36 The total risks differed by about 10% Other results for Atlas HAS are given in Table 21 and for Delta in Table 23 Other calculations for Atlas and Delta show that the value of is not 9/10/96 77 RTI [PAGE 87] important in the launch-area risk calculations provided an appropriate value of A is selected Since a good data match within ±40° of the flight line was not found the effect of this on ship-hit calculations was investigated It was discovered that the values chosen for A and made no significant difference since the risks to shipping near the flight line are totally dominated by the Mode-4 failure response see Section-6.2.3 Mode-5 baseline risks for Atlas and Delta were recomputed using newly derived values for shaping constants A and the overall vehicle failure probability and the relative probabilities of occurrence of the individual failure-response modes Results were then compared with baseline risks computed in prior RTI studies For Atlas Mode-5 launch-area risks were reduced by a factor between to- 11 the exact value depending on the assumed breakup qa for the vehicle For Delta the reduction factor was between and 75 with the exact value again depending on assumed breakup conditions 9/10/96 78 [PAGE 88] Appendix A Failure Response Modes In Program DAMP In program DAMP no attempt is made to model vehicle behavior for failure of specific systems and components A list of such failures and possible behaviors for any vehicle would be extensive and variations from vehicle to vehicle would complicate the modeling process or make it almost impossible Instead failure responses are modeled in DAMP without regard to the specific failure that causes the response There are only six possible response modes in DAMP five for failures and one to model the behavior of a normal vehicle The six vehicle-response modes are described in layman's language as follows technical descriptions are provided in Ref Mode Vehicle topples over or falls back on the launch point after a rise of at most a few feet Propellants deflagrate or explode with some assumed TNT equivalency Mode Vehicle loses control at or shortly after liftoff with all flight directions equally likely Destruct is transmitted as soon as erratic flight is confirmed usually no later than six to twelve seconds after launch For each vehicle a latest destruct time is established that is used in computing the maximum impact distance for pieces given that a Mode-2 response has occurred Mode Vehicle fails to pitch-program normally producing near-vertical flight while thrusting at normal levels Vehicle may tumble rapidly out of control at any point during vertical flight resulting in spontaneous breakup or may be destroyed when destruct criteria are violated The mode is terminated by destruct action if the vehicle reaches the so-called 11 straight-up time without programming This time varies with launch vehicle and with mission but usually occurs at Cape Canaveral Air Station between 30 and 70 seconds after launch Mode Vehicle flies within normal limits until some malfunction terminates thrust causes spontaneous breakup or results in destruct by flight-control personnel Breakup may or may not be preceded by a rapid tumble while the vehicle is still thrusting but in any event vehicle debris and components impact near the intended flight line Mode Vehicle may impact in any direction from the launch point within its range capability At any range impacts are most likely to ocrur along the flight line becoming less likely as the angular deviation from the flight line increases As the impact range increases weighting is progressively increased to favor the downrange direction In any fixed direction the impact probability decreases as the impact range increases Flight may terminate spontaneously due to complete loss of vehicle stability or because of destruct action Outside the launch area any malfunction with the potential to cause a substantial deviation from the intended flight direction is classified as a Mode-5 failure response By definition Mode-5 9/10/96 79 RTI [PAGE 89] responses begin at vehicle pitch-over or programming for vertically-launched missiles and at liftoff for those not launched vertically Mode Unlike impacts from response Modes through Mode-6 impacts result from normal flights and normal impacts of separated stages and components Jettisoned components are assumed to be non-explosive For each impacting stage or component a mean point of impact and bivariate-normal impact dispersions in downrange and crossrange components are assumed The impact dispersions include the effects of variations in vehicle performance drag uncertainties and winds Of the five failure-response modes only Mode is modeled to- allow for the possibility of failure of the flight termination system since vehicles experiencing other failure responses tend to impact within the impact limit lines In DAMP risk computations for Modes through are based on the assumption that the flight termination system is successfully employed when required Failure responses originally classified as Mode or may be reclassified as Mode if the flight termination system fails or subsequent vehicle performance does not conform with the original response-mode definition Risks associated with vehicle failure responses accompanied by a failure of the flight termination system are assumed to be adequately modeled in DAMP by Mode The five failure-response modes modeled in DAMP are sufficient to account for all anomalous impacts in the estimation of risks However some vehicle failures and anomalous behaviors have an effect on mission success without increasing risks to people and property on the ground These behaviors have been assigned Mode NA not applicable in the response-mode column of the launch-history tables in Appendix 9/10/96 80 RTI [PAGE 90] Appendix Shaping-Constant Effects on Mode-5 Impact Distributions The values chosen for shaping constants A and that appear in the Mode-5 impact-density function Eq have a significant effect on the angular distribution of impacts about the launch point This Appendix shows the effects of A and on the ratio of impacts along the downrange line to any other radial through the launch point and the percentages of impacts in various sectors relative to the downrange line Following the procedures outlined in Section 9.7 of Reference it is interesting to observe the effects of varying the constants A and This is done in terms of a so-called f-ratio which is expressed in Ref as Eq 9.19 and is repeated here eAit+B £-ratio eA•+- The ratio shows how much more likely impact is to occur along the flight line where I than along some other radial line that makes an angle with the flight line Table 33 and Table 34 present £-ratios for values of A 2.5 3.0 3.5 and 4.0 and 1000 for impact ranges from one to 25 miles Table 35 and Table 36 show the effects of halving and doubling the constant for a fixed value of A 3.0 Before citing numerical examples it should be emphasized that the data in Table 33 through Table 36 are derived from the primary Mode-5 impact-density function and as such they indicate likelihood ratios for the location of the secondary Mode-5 density functions A secondary function it will be remembered describes the dispersion of a debris class about the impact point of the mean piece in the class Thus referring to Table 34 with A 3.0 it can be seen that the secondary impact-density function for a debris class is 4.7 times more likely to be centered 10 miles downrange along the flight line than 10 miles from the launch point along a radial line that makes a 30° angle with the flight line As another example the secondary function i.e the impact point for the mean piece in a debris class is 82.2 times more likely to be located 25 miles downrange along the flight line than 25 miles crossrange 90° and assuming no destruct action that it is 303.2/82.2 3.7 times more likely to be located 25 miles crossrange than 25 miles uprange 180° 9/10/96 81 RTI [PAGE 91] Table 33 Effect on £-Ratio of Varvimz Mode~5 Constant A 1000 Part R=lnm R=5nm A=3.0 A=3.5 A=4.0 A=2.5 1.0 A=4.0 A=3.5 A=2.5 A=3.0 180-cl 1.0 1.4 1.0 1.0 1.0 1.0 1.0 1.0 1.4 2.0 1.3 1.2 1.4 1.3 1.3 1.2 1.8 15 1.7 1.5 2.0 1.8 1.6 10 1.3 2.8 20 2.5 2.2 2.8 1.8 2.0 2.4 1.5 4.0 5.7 3.4 2.8 2.2 4.0 2.5 3.3 1.7 4.6 30 2.6 3.6 5.6 4.3 3.1 1.9 25 8.1 11.4 6.1 4.5 3.1 7.9 5.8 2.1 3.7 8.3 40 3.7 5.8 11.1 7.6 2.3 4.5 35 16.1 45 11.1 7.3 4.3 15.5 5.3 9.8 2.5 22.8 50 14.9 9.2 4.9 21.5 12.6 6.2 2.6 32.1 45.1 11.4 19.9 5.7 7.0 15.9 29.5 2.8 26.3 60 14.1 6.4 40.2 19.7 7.9 2.9 55 63.1 65 34.7 17.1 7.2 24.0 53.8 8.7 3.0 87.8 70 45.2 20.6 7.9 70.7 28.5 9.5 3.1 121.4 75 58.2 24.3 8.6 33.1 91.0 10.2 3.2 166.3 80 73.8 28.5 9.3 37.6 113.9 10.8 3.3 224.8 85 92.1 32.5 10.0 138.6 11.3 41.8 3.3 299.2 390.1 112.6 36.5 10.5 163.6 45.5 11.7 3.4 134.7 4%.7 40.4 11.1 187.4 48.7 12.1 3.4 90 157.4 100 44.1 11.5 51.4 208.9 12.3 3.4 95 615.2 105 179.9 47.3 11.9 227.2 53.5 12.6 3.5 739.7 110 200.9 50.2 12.3 242.2 55.2 12.7 3.5 862.9 115 219.9 52.7 12.5 254.1 56.5 12.9 3.5 977.7 120 54.7 236.4 12.8 263.1 57.6 13.0 3.5 1079.0 125 250.2 56.4 13.0 270.0 58.3 13.1 3.5 1164.0 130 261.4 57.8 13.2 275.0 58.9 13.2 3.5 1232.6 135 270.4 58.9 13.3 278.6 59.4 13.2 3.5 1286.0 140 277.4 59.8 13.4 281.2 59.7 3.6 13.3 1326.5 145 282.8 60.5 13.5 283.1 59.9 3.6 13.3 286.9 1356.7 150 61.1 13.6 284.5 13.3 60.1 3.6 290.0 1378.8 155 61.5 13.6 285.4 13.3 60.2 3.6 292.3 1394.8 62.1 61.8 13.7 286.1 60.3 13.3 3.6 294.1 1406.3 165 13.7 286.6 60.4 3.6 13.4 160 295.4 1414.6 170 62.3 13.7 286.9 60.5 13.4 3.6 2%.3 1420.5 175 62.4 287.2 13.8 60.5 3.6 13.4 297.0 1424.7 297.6 1427.6 62.6 13.8 287.3 60.5 13.4 3.6 62.6 13.8 287.5 60.5 13.4 180 3.6 RTI 9/10/96 82 [PAGE 92] Table 34 Effect on £-Ratio of Varving Mode-5 Constant A 1000 Part 10run 5nm 180-ct A=2.5 A=3.0 A=3.5 A=4.0 A=2.5 A=3:o A=3.5 A=4.0 1.0 1.0 1.0 1.0 1.0 1.0 1.0 1.0 1.2 1.3 1.4 1.4 1.2 1.3 1.4 1.4 10 1.5 1.7 1.8 2.0 1.5 1.7 1.8 2.0 15 1.9 2.2 2.5 2.8 1.9 2.2 2.5 2.8 20 2.3 2.8 3.4 4.0 2.3 2.8 3.4 4.0 25 2.8 3.6 4.6 5.7 2.9 3.7 4.6 5.7 30 3.4 4.7 6.2 8.1 3.6 4.8 6.2 8.1 35 4.1 6.0 8.4 11.5 4.4 6.1 8.4 11.5 40 4.9 7.7 11.3 16.2 5.3 7.9 11.4 16.3 45 5.8 9.8 15.3 23.0 6.5 10.2 15.5 23.1 50 6.8 12.4 20.5 32A 7.9 13.2 20.9 32.7 55 8.0 15.7 21.5 45.8 9.6 16.9 28.3 46.2 60 9.3 19.7 36.7 64.5 11.5 21.6 38.1 65.4 65 10.7 24.4 48.8 90.6 13.7 27.5 51.2 92.3 70 12.1 29.9 64.3 126.7 16.2 34.8 68.7 130.2 75 13.5 36.3 84.1 176.4 19.0 43.8 91.7 183.1 80 15.0 43.4 108.6 243.9 22.1 54.5 121.8 256.9 85 16.4 51.1 138.4 333.9 25.4 67.3 160.6 358.9 90 17.8 59.1 173.5 451.4 28.8 82.2 209.9 498.3 95 19.0 67.3 213.3 600.5 32.4 98.9 271.3 686.6 100 20.1 75.3 256.8 782.9 35.9 117.3 345.7 936.0 105 21.2 82.9 302.1 996.3 39.4 137.0 433.3 1258.3 110 22.1 89.8 347.2 1233.5 42.7 157.2 532.8 1662.1 115 22.9 96.0 390.2 1482.5 45.9 177.4 641.3 2148.4 120 23.5 101.4 429.4 1728.6 48.7 196.9 754.5 2707.0 125 24.1 106.0 463.6 1957.9 51.3 215.0 867.2 3315.0 130 24.6 109.9 492.6 2159.9 53.5 231.5 974.6 3939.0 135 25.0 113.0 516.4 2329.5 55.5 245.9 1072.3 4542.1 140 25.3 115.5 535.5 2466.0 57.2 258.3 1158.0 5092.0 145 25.6 117.6 550.4 2572.4 58.6 268.8 1230.3 5567.4 150 25.8 119.2 562.0 2653.1 59.9 277.4 1289.7 5959.9 155 26.0 120.5 570.8 2713.1 60.9 284.5 1337.3 6271.7 160 26.1 121.5 577.5 2757.1 61.7 290.1 1374.6 6512.1 165 26.3 122.2 582.5 2789.0 62.4 294.6 1403.5 6693.0 170 26.4 122.8 586.3 2812.0 63.0 298.2 1425.6 6826.7 175 26.4 123.3 589.1 2828.4 63.4 301.0 1442.3 6924.4 180 26.5 123.7 591.2 2840.1 63.8 303.2 1454.9 6994.9 9/10/% 83 RTI [PAGE 93] Table 35 Effect on £-Ratio of Varving Mode-5 Constant A Part nm R=5nm 180--(1 8=500 1000 8=2000 8=500 1000 2000 1.0 1.0 1.0 1.0 1.0 1.0 1.3 1.3 1.2 1.3 1.3 1.3 10 1.6 1.6 1.5 1.7 1.7 1.7 15 2.1 2.0 1.9 2.2 2.2 2.1 20 2.7 2.5 2.3 2.8 2.8 2.7 25 3.4 3.1 2.7 3.6 3.6 3.4 30 4.2 3.7 3.1 4.7 4.5 4.3 35 5.2 4.5 3.6 6.0 5.8 5.4 40 6.4 5.3 4.1 7.7 7.3 6.6 45 7.7 6.2 4.5 9.8 9.2 8.1 50 9.2 7.0 5.0 12.4 11.4 9.8 55 10.8 7.9 5.3 15.7 14.1 11.7 60 12.4 8.7 5.7 19.7 17.1 13.7 65 14.1 9.5 6.0 24.4 20.6 15.8 70 15.8 10.2 6.2 29.9 24.3 17.8 75 17.3 10.8 6.4 36.3 28.5 19.9 80 18.7 11.3 6.6 43.4 32.5 21.8 85 20.0 11.7 6.7 51.1 36.5 23.5 90 21.1 12.1 6.8 59.1 40.4 25.0 95 22.0 12.3 6.9 67.3 44.1 26.3 100 22.8 12.6 7.0 75.3 47.3 27.5 105 23.4 12.7 7.0 82.9 50.2 28.4 110 23.9 12.9 7.1 89.8 52.7 29.1 115 24.3 13.0 7.1 96.0 54.7 29.7 120 24.6 13.1 7.1 101.4 56.4 30.2 125 24.9 13.2 7.1 106.0 57.8 30.6 130 25.1 13.2 7.1 109.9 58.9 30.9 135 25.3 13.3 7.2 113.0 59.8 31.2 140 25.4 13.3 7.2 115.5 60.5 31.3 145 25.5 13.3 7.2 117.6 61.1 31.5 150 25.5 13.3 7.2 119.2 61.5 31.6 155 25.6 13.3 7.2 120.5 61.8 31.7 160 25.6 13.4 7.2 121.5 62.1 31.8 165 25.7 13.4 7.2 122.2 62.3 31.8 170 25.7 13:4 7.2 122.8 62.4 31.8 175 25.7 13.4 7.2 123.3 62.6 31.9 180 25.7 13.4 7.2 123.7 62.6 31.9 RTI 9/10/96 84 [PAGE 94] Table 36 Effect on £-Ratio of Varying Mode-5 Constant A Part R=l0nm R=25nm 180 I B=500 1000 B=2000 500 1000 2000 1.0 1.0 1.0 1.0 1.0 1.0 1.3 1.3 1.3 1.3 1.3 1.3 10 1.7 1.7 1.7 1.7 1.7 1.7 15 2.2 22 2.2 2.2 2.2 2.2 20 2.8 2.8 28 2.8 2.8 2.8 25 3.7 3.6 3.6 3.7 3.7 3.6 30 4.7 4.7 4.5 4.8 4.8 4.7 35 6.1 6.0 5.8 6.2 6.1 6.0 40 7.9 7.7 7.3 8.0 7.9 7.8 45 10.2 9.8 9.2 10.4 10.2 9.9 50 13.0 12.4 11.4 13.4 13.2 12.7 55 16.7 15.7 14.1 17.3 16.9 16.1 60 21.2 19.7 17.1 22.3 21.6 20.3 65 26.9 24.4 20.6 28.7 27.5 25.3 70 33.9 29.9 24.3 36.8 34.8 31.3 75 42.3 36.3 28.3 47.0 43.8 38.5 80 52.3 43.4 325 59.7 54.5 46.6 85 63.9 51.1 36.5 75.4 67.3 55.5 90 77.1 59.1 40.4 94.5 82.2 65.2 95 91.7 67.3 44.1 117.4 98.9 75.3 100 107.3 75.3 47.3 144.4 117.3 85.5 105 123.5 82.9 50.2 175.4 137.0 95.4 110 139.7 89.8 52.7 210.1 157.2 104.7 115 155.4 96.0 54.7 247.9 177.4 113.3 120 170.1 101.4 56.4 287.7 196.9 120.9 125 183.5 106.0 57.8 328.3 215.0 127.5 130 195.3 109.9 58.9 368.2 231.5 133.1 135 205.5 113.0 59.8 406.3 245.9 137.7 140 214.1 115.5 60.5 441.4 258.3 141.5 145 221.2 117.6 61.1 472.8 268.8 144.6 277.4 147.1 150 227.0 119.2 61.5 500.3 155 231.7 120.5 61.8 523.6 284.5 149.0 290.1 150.5 160 235.4 121.5 62.1 543.2 165 238.4 122.2 62.3 559.3 294.6 151.7 240.7 122.8 62.4 572.3 298.2 152.7 170 62.6 582.7 301.0 153.4 175 242.5 123.3 62.6 591.0 303.2 154.0 244.0 123.7 180 9/10/96 85 RTI [PAGE 95] The £-ratios in Table 33 and Table 34 also in·Table 35 and Table 36 have been plotted in Figure 32 for A 3.0 arid 1000 Reading from the 10-mile plot for 90° it can be seen that a vehicle experiencing a Mode-5 response is about 60 times more likely to impact along the flight line than along the 90-degree radial Essentially the same value actually 59.1 appears in Table 34 300 15 a 250 200 150 Figure 32 £-Ratios for Ranges from to 25 Miles 9/10/96 86 RTI [PAGE 96] There are other ways to show how the value chosen for A affects the Mode-5 impact density function For five values of A the plots in Figure 33 show the percentages of Atlas IIAS impacts that lie between the flight line and any radial line through the launch point that makes an angle with respect to the flight line If A 3.0 it can be seen that approximately 46% of all Mode-5 impacts lie between and 20° If A is 4.0 the percentage of impacts between and 20° increases to about 64% 100 90 80 70 60 I 50 I Data jfor Atl IIA a i 40 i 000 i 30 I I 20 r·•,l-r A 10 I 20 40 60 80 100 120 140 160 180 Theta deg Fi gure 33 Percentage of Impacts Between Flight Line and Any Radi al The Mode-5 impact density function must be integrated numerically to arrive at the values plotted in Figure 33 Since the quantity that appears in the density function is trajectory dependent somewhat different curves would be obtained for other trajectories and vehicles 9/10/96 87 RTI [PAGE 97] Another way to show how the value of A affects Mode-5 impacts is illustrated in Figure 34 For the same values of A used previouslyin Figure 33 the graphs in Figure 34 show the percentages of impacts in any sector between radials that make angles of and with respect to the flight line It is interesting to note that if A is set equal to 1.0 with 1,000 impacts in all sectors are approximately the same thus resulting in an impact-density function that is essentially uniform in direction Oat for Atlas IIAS I 10Jo -iA A 10 I i -----jA 3jo 4•0 I I I A sJo en a 0.1 i I 20 40 60 80 100 12n 140 160 180 Angle from Flight Path Theta deg Figure 34 Percentage of Impacts in 5-Degree Sectors For A the Mode-5 impact-density function is essentially the same as a density function formerly used in the Launch Risk Analysis LARA Program at the Western Range to model gross azimuth failures This response mode was called the Gross Flight Deviation Failure GFDF mode In LARA the range and azimuth portions of the GFDF density function were assumed to be independent Impact azimuths were uniformly distributed while the range density function can be represented as 9/10/96 88 RTI [PAGE 98] where is the probability of occurrence of the GFDF mode TB is the stage bum time and is the rate of change of the impact range The function cannot be applied early in flight before programming when is essentially zero The range portion of the Mode-5 impact-density function used in DAMP reduces to essentially the same form If Eq is integrated between the limits of zero and the conditional Mode-5 density function reduces to where TP is the programming time and TB and Rare as previously defined To obtain absolute values f(R must of course be multiplied by the probability of occurrence of a Mode-5 failure response Although the GFDF density function may be a suitable model for random-attitude failures occurring at or a few seconds after programming the performance histories in Appendix indicate that such failures are no more likely to occur at programming than at any other time Thus there appears to be no need for including a GFDF mode per se in the risk calculations since all random-attitude failures are accounted for by the Mode-5 density function However if for some obscure reason inclusion of a GFDF response mode is desired two approaches are possible run the GFDF mode separately in DAMP by using Mode-5 with A while zeroing out all other response modes modify DAMP to handle two separate Mode-5 density functions each with its own values of A and Obviously approach is much more involved and time consuming to implement Although it may not be obvious the probability of impact in any annular range interval obtained by integrating the Mode-5 density function between the interval boundaries is independent of the values assigned to A and Eq is integrated between the angle limits of zero and and only for these limits the A's and B's cancel leaving the probability of impact between and as a function of impact range alone With a change of variable the probability of impacting between and becomes a simple function of time see pages 84 and 85 of Ref for details 9/10/96 89 RTI [PAGE 99] Appendix Filter Characteristics Estimating launch-vehicle failure probabilities using empirical launch data is an uncertain process when the sample size is small and the data are obtained from an evolving system One approach that may be used to estimate failure probabilities is to perform a least-squares fit to trial outcome values success failure For mature launch vehicles failure probabilities have decreased markedly from their early experimental days For new programs empirical data may be scant or nonexistent One decision that must be made involves the type of function to- fit to the data The true nature of the failure-rate function may be unknown or extremely complex or there may be insufficient data to estimate a complex function The easiest calculation is made when a constant failure-rate function is assumed However available data appear to indicate that failure rates decrease as a program matures at least up to a point If it can be assumed that launch-vehicle failure probabilities decrease over time i.e as the number of launches increases then some non-constant function perhaps linear or exponential can be chosen for the fit or the data weighted as a function of time In estimating Atlas reliability General Dynamics 161 chose the latter option by adopting the Duane model model is based on the assumption that the mean number of launches between failures increases when causes of failure are corrected Although this may be the case up to- a point eventually reliability seems to level off at a fairly constant value Consequently for mature programs RTI has chosen to fit the failure- rate function to a constant Su<;h a fit can be based on simple least squares using a fixed-length sliding-window filter to allow for changes in the estimated value over time or on a least squares fitwith unequal weighting If a constant function is fit to a set of data using least squares with equal weighting of data the solution is given by the mean 10 Consider the following example Then Recursively 6+5+7 -18 11 9/10/96 90 RTI [PAGE 100] Xn Xn-1 1-an xn an 12 Xn Xn-1 an xn -Xn-1 For the equally-weighted case the recursive filter factor an Using the same example with 13 In general terms this recursive formulation of the least squares solution is called an expanding-memory filter as opposed to a sliding-window or fixed-length filter In an expanding-memory filter the solution is always based on the entire data set In the equally-weighted case all data points have an equal influence on the solution regardless of their locations in the sequence It can be seen that in the limit as becomes very large an approaches zero That is each data point in the sequence is accorded a decreased weight due to the increased number of points being fit If the data being fit should actually describe a constant this is exactly what is desired Normally however the function that the data should fit is unknown and a constant function is used merely as an approximation to smooth or edit the data What is desired is a recursive least squares fit that assigns a decreasing weight to data of increasing age so the fit de-weights data points used in earlier recursions In a fading-memory filter the weighting factor decreases as time recedes into the past so that the importance of any given datum will decrease as the age of the datum increases An example of such a filter is one in which each datum is weighted by its count or index number in the sequence I,i xi Xn i=l L,i 14 i=l Using the same numerical example as before where and 1-6+2•5+3•7 37 6.17 15 1+2+3 9/10/96 91 RTI [PAGE 101] For the recursive form of this filter where each datum is weighted by its position in the chronological sequence the recursive filter factor for the th point is given by 16 i n·(n+l n+l i=l Using Eq 12 17 The memory i.e importance of older data in this filter fades at a rate dictated by the filter In this case the 50 th value is 50 times more important than the first and the 100 th value is twice as important as the 50 th and 100 times more important than the first The exponentially-weighted filter provides the analyst with more flexibility This filter uses as a weighting factor where the filter-control constant is a value chosen between zero and one and i is the age-count of the i th data point For this filter i now designates the current -or latest data point i designates the immediately preceding or next-to-last data point etc so the data points are indexed in reverse chronological order starting with zero The weighted least-squares solution is 18 Using and the same example as before Fox3 F1x2 F2x1 po +Fl +(.9)2(6 19 4.5 4.86 16.36 6.04 2.71 2.71 The weighting of each data point for sample sizes up to 300 is sqown in Figure 35 for values of from 0.8 to 1.0 For all points in the sample are weighted equally For 9/10/96 92 RTI [PAGE 102] 0.8 only the most recent 25 or so data points contribute to the final result since all older data points are essentially weighted out of the solution 1.0 0.9 0.8 0.7 i 0.6 0.5 i equally weighted F=0.J9 I I 0.9 i I ca 0.4 Cl 0.3 0.2 0.1 0.0 ca i 0.99 +o.s I 50 100 150 200 250 300 Data Index older- Figure 35 Exponential Weights for Fading-Memory Filters For the exponentially-weighted fading-memory filter it can be shown that the recursive filter factor used in Eq 12 is 20 1-Fn Since OS an in Eq 20 does not approach zero as approaches infinity as the other two filters do but instead approaches the value If then an for all the filter has no memory at all and the filtered value always equals the last measurement In the limit as approaches one L'Hospital rule can be applied to 9/10/96 93 RTI [PAGE 103] show that an approaches the filter-factor value for the equally-weighted case and the filter memory no longer fades For values of between zero- and one the rate at which the filter memory fades decreases as increases The analyst can control the rate at which the filter memory fades by selecting an appropriate value of As the number of points increases the value of an used in the recursive exponential- filter equation decreases continuously as it asymptotically approaches For any given a larger an means more emphasis is placed on the current data point and less on previous points That is the larger the recursive filter factor an the faster the filter memory fades Filter factors for sample sizes up to- 300 points are shown in Figure 36 for six different filters Early in the data-index count less than 30 the filter based on index-number weighting has the fastest fading memory since for 30 data points or fewer the filter has the largest filter factors After 160 points or so the index-weighted filter fades at a slower rate than the exponential filter with 0.99 Consequently users of index-count-based fading filters frequently calculate a filter factor for some maximum value of that is then applied to all subsequent data points as well For example if a maximum count of about 180 is used for this filter from that point on will behave similarly to the exponentially-fading filter with 0.99 LL i a 0.1 0.01 0.001 50 100 150 200 250 300 Number of Data Points in Sample Figure 36 Recursive Filter Factor for Last Data P-oint 9/10/96 94 RTI [PAGE 104] The fading-memory recursive filter defined by Eqs 12 and 20 can be applied to launch test results to estimate failure probability For this application the values to be filtered are the test outcomes with representing a successful launch and representing a failure or anomalous behavior Given a series of outcomes the filtered result after each launch in the series represents the estimate of failure probability at that point Filtered results for two filter-control constants are shown in Table 37 for a hypothetical series of ten launches for which all but the second and fourth flights were successful Table 37 Filter Application for Failure Probability 0.98 0.90 Index Outcome lter factor an Fail Prob Filter factor an Fail Prob 10 1.0000 0.5051 0.3401 0.2576 0.2082 0.1752 0.1517 0.1340 0.1203 0.1093 0.0 0.5051 0.3333 0.5051 0.3999 0.3299 0.2798 0.2423 0.2132 0.1899 1.0000 0.5263 0.3690 0.2908 0.2442 0.2132 0.1917 0.1756 0.1632 0.1535 0.0 0.5263 0.3321 0.5263 0.3978 0.3129 0.2529 0.2085 0.1745 0.1477 In this example estimated failure probabilities are shown for two values of the filter constant that force the filter to fade at two different rates After ten launches the estimated failure probability using 0.98 is 0.1899 For the faster fading-memory filter 0.90 the result is 0.1477 Both estimates are less than that obtained by equal weighting since the two failures occurred early in the sequence Note that after four launches successes and failures both filtered estimates exceed 0.5 since one of the two failures occ~rred during the fourth flight If the l's and O's used in the example to represent failures and successes were reversed the same filter would provide estimates of probability of success 9/10/96 95 [PAGE 105] Appendix Launch and Performance Histories 0.1 S-asic Data In support of the empirical approach to use post-test results to estimate future vehicle failure rates the performance histories for Atlas Delta Titan and Thor missiles vehicles were studied Results are summarized in Appendix Das follows Appendix Atlas Launch and Performance History Appendix Delta Launch and Performance History Appendix Titan Launch and Performance History Appendix Thor Launch and Performance History The histories include all Atlas Delta and Titan launches from the Eastern and Western Ranges prior to September 1996 For Thor only Eastern Range launches are included since this summary was completed before it was decided not to use Thor results in predicting failure probabilities for Delta The Atlas Titan and Thor summaries include both weapons systems tests and space flights while the Delta summary includes only space flights For each vehicle each section of the appendix is divided into two parts A tabular summary listing all launches in chronological order by sequence number a mission identifier launch date vehicle configuration launch range the failure-response mode to which any failure has been assigned the flight phase in which the failure or anomalous behavior occurred and a configuration flag or indicating whether the vehicle is sufficiently representative of current vehicles to be included in the data sample used to predict vehicle reliability A brief narrative necessarily brief in most cases due to lack of information describing the general nature of the failure or the behavior of the vehicle after failure or the effects of the failure on flight parameters Data S-ources The vehicle performance summaries and histories were collected primarily from the following sources Eastern Range Launches 1950-1994 Chronological Summary 45th Space Wing History Office 171 Extension to updating the launch summary through 30 December 1995.rsi Vandenberg AFB Launch Summary Headquarters 30th Space Wing Office of History Launch Chronology 1958 -1995.r 91 9/10/96 96 RTI [PAGE 106] Spacelift Effective Capacity Part Launch Vehicle Projected Success Rate Analysis Draft prepared by Booz•Allen Hamilton Inc 19 February 1992 prepared for Air Force Space Command Launch Services Office 141 Isakowitz Steven updated by Jeff Samella International Reference Guide to Space Launch Systems Second Edition published and distributed by AIAA in 1995.[to Smith Launch Systems for Manned Spacecraft Draft July 23 1991Y 11 Comparison of Orbit Parameters Table prepared bl McDonnell Douglas Space Systems Company Delta launches through Nov 95 121 Missiles/Space Vehicle Files 45th Space Wing Wing Safety Mission Flight Control and Analysis SEO 1957 through 1995 1131 Missile Launch Operations Logs 30th Space Wing copies provided via ACTA Inc Mr James Baeker 1963 through 1995 141 10 Titan IV America's Silent Hero published by Lockheed Martin in Florida Today 13 Nov 95 1151 11 Atlas Program Flight History through April 1965 General Dynamics Report EM-1860 26 April 1965 1161 12 Fenske Atlas Flight Program Summary Lockheed Martin April 1995 17 13 Brater Bob Launch History Lockheed Martin FAX to RTI March 13 1996 181 14 Several USAF Accident/Incident Reports for Atlas and Titan failuresY 91 15 Quintero Andrew Launch Failures from the Eastern Range Since 1975 Aerospace memo February 25 1996 provided to RTI by Bill Zelinsky 1201 16 Set of Titan Flight Anomaly Failure Summary since 1959 received from Lockheed Martin April 1996.i 211 17 Chang I-Shih Space Launch Vehicle Failures 1984 1995 Aerospace Report No TOR-96(8504)-2 January 1996 221 There were numerous discrepancies in the source data particularly with regard to launch date and vehicle configuration Some sources apparently list launch dates in local time others use Greenwich time and in some cases the same source may use both with no indication of which is which Most of the launch dates shown in Appendix agree with those in the Eastern Range and Western Range summaries published by the respective History offices Since the dates on these summaries are not consistently local or Greenwich neither are the dates listed in Appendix Although launch dates are 9/10/96 97 [PAGE 107] used to order the vehicle tests for filtering whether the dates are inconsistently in local or Greenwich times is inconsequential In most cases the ordering is not affected by a one-day change in launch date In rare cases where the order of two launches might be inadvertently reversed the filtering calculations are unaffected if the interchanged flights are both failures or both successes Even when this is not the case the effect on the final results for samples greater than one-hundred is negligible Configuration discrepancies also existed in the source data as for example the listing of the same Atlas vehicle as a IIA in one source and as a HAS in another In rare cases a launch may have been called a success in one document and a failure in another with little or no data provided to make it clear whether the difference in classification was due to error or different success criteria Although a considerable effort was made to eliminate errors and discrepancies in Appendix there can be no assurance that the effort was 100% successful D.1.2 Assignment of Failure-Response Modes In the tabular historical summaries in Appendix the column labeled Response Mode refers to the failure-response modes in program DAMP The numbers through in this column correlate with the failure-response modes described in Appendix A The letter following either a or indicates that the vehicle executed a thrusting tumble before breakup or destruct An NA i.e not applicable appearing in the column means that some anomalous behavior caused stages or components to impact outside their normal impact areas without necessarily failing the flight or that the anomalous behavior resulted in an unplanned orbit that may or may not have interfered with mission objectives If the response-mode column is blank either the flight was a success or there was no information in the data sources to indicate otherwise In some cases where the data sources contained only sketchy or incomplete information assignment of the response mode involved some speculation Mostly this situation arose in trying to decide between response modes and or between modes and or in rare cases what mode to assign when the vehicle response did not exactly -fit any of the response-mode definitions D.1.3 Assignment of Flight Phase The number shown in the Flight Phase 11 column in the tabular summaries of Appendix indicates the phase of vehicle flight in which the failure or anomalous behavior occurred Definitions of flight phase are given in Table 38 The assigned numbers are arbitrary but were chosen in a way that suggests the vehicle stage that failed or the stage that was thrusting when the failure occurred 9/10/96 98 RTI [PAGE 108] Table 38 Flight-Phase Definitions Flight Phase Description SRM auxiliary thrust phase First-stage thrust phase if no auxiliary SRM's carried or First-stage thrust phase after SRM separation 1.5 Attitude-control phase after first-stage thrust phase or between first and second-thrust phases 2.5 Second-stage thrust phase Attitude-control phase after second thrust phase or between second and third-thrust phases Third-stage thrust phase or third thrust phase if second stage is restartable 3.5 Attitude-control phase after third thrust phase or between third and fourth thrust phases Fourth thrust phase or Upper stage/payload thrust phase Attitude control phase after Flismt Phase or orbital phase In some cases two•flight phases are listed opposite an entry e.g and This means that some failure or anomalous behavior occurred during the second-stage thrusting period that did not prevent the attainment of an orbit but did result in an abnormal final orbit Other somewhat arbitrary decisions were necessary in assigning a flight phase when an expended stage failed to separate or an upper stage failed to ignite If for example the first and second stages failed to separate any of flight phase 1.5 or could be assigned depending on the exact cause of the failure The detailed information needed to make the proper choice was sometimes lacking Table 39 is provided to assist in understanding how flight phases were assigned for Atlas Delta/Thor and Titan vehicles Table 39 Flight Phases by Launch Vehicle Flight Phase Atlas Deltall'hor Titan Castor burn Castor GEM burn SRMsolo 1.5 Atlas booster Booster separation Sustainer First-stage bum Vernier solo Sep 1/2 Second-stage bum Stage Stage-1 separation Stage 2.5 Vernier ACS solo Coast between stg Vernier solo TS/Centaur/IDS Second burn 3.5 Agena/Centaur Second bum Third-stage bum Coast after stg Second bum Orbit Orbit Orbit 9/10/96 99 RTI [PAGE 109] 0.1.4 Representative Configurations The last column in the tables in Appendix indicates whether the vehicle configuration is considered sufficiently similar to- current and future vehicles for the test result to be included in the representative data sample used to predict absolute reliability A in the column indicates that the test result is included while a indicates that it is excluded There are likely to be differences of opinion about which past configurations are representative and which are not In determining which to include RTI has relied entirely on the Booz•Allen Hamilton report 41 referred to earlier When faced with the same problem Booz•Allen established the following criteria for deciding whether past configurations were sufficiently similar to current configurations Genealogy Is the current system a direct or indirect derivative of the historical configuration Operations Is the current system operated in the same manner as the historical configurations e.g ICBM versus space-launch vehicle Composition Does the current system use the same types of elements i.e SRMs upper stage etc Based on these criteria and other factors Booz•Allen decided to use test results from flights of the following vehicle configurations to predict future success rates Atlas SL and later configurations to include SL V-3A SL V-3C SL V-3D I II IIA ITAS Excluded Atlas A V-3A Delta 291X and later configurations to include 391X 392X 492X 592X 692X 792X Titan Titan IIIC and later configurations to include IIIB IIID IIIE 34B 34D III/CT IV II-SLV 9/10/96 100 [PAGE 110] Atlas Launch and Performance History Atlas space-launch vehicles originally manufactured by General Dynamics and currently by Lockheed Martin derived from the Atlas ICBM series developed in the 1950s The primary one-and-one-half-stage vehicle played a major role in early lunar exploration activities the unmanned Ranger Lunar Orbiter and Surveyor programs and planetary probes Mariner and Pioneer Table 40 shows a summary of Atlas configurations since the beginning of the program.[1° Table 40 Summarv of Atlas Vehicle Configurations onfiguration scription A ICBM single-stage test vehicle B,C ICBM 1½-stage test vehicle ICBM and later space-launch vehicle E,F First an ICBM 1960 then a reentry test vehicle 1964 then a space-launch vehicle 1968 LV-3A Same as except Agena upper stage LV-3B Same as except man-rated for Project Mercury SLV-3 Same as V-3A except reliabilitv improvements SLV-3A Same as SL except stretched 117 inches LV-3C Integrated with Centaur upper stage SLV-3C Same as LV-3C except stretched 51 inches SLV-3D Same as SL V-3C except Centaur uprated to D-lA and Atlas electronics integrated with Centaur no longer radio guided Same as SLV-3D but Atlas stretched 81 inches Same as SLV-3D except with E/F avionics and no Centaur I Same as except strengthened for 14-ft payload fairing ring laser gyro added II Same as I except Atlas stretched 108 inches engines uprated hydrazine roll-control added verniers deleted Centaur stretched 36 inches IIA IIAS Same as II except Centaur RL- l0s engines uprated to 20K lbs thrust and 6.5 seconds lsp increase from extendible RL-10 nozzles Same as IIA except Castor IV A strap-on SRMs added Atlas A and were developmental ICBMs Atlas and configurations were deployed as operational ICBMs during the 1960s During that time some Atlas Ds were modified as space-launch vehicles in the LV series V-3A and The Standardized Launch Vehicle SL series derived from a need to reduce lead times in transforming Atlas missiles to space-launch vehicles The SL series began with the SLV-3 vehicle which used an Agena upper stage The and vehicles evolved from the SL series Eventually the I II IIA and IIAS configurations were developed with the aim of also supporting commercial launches 9/10/96 101 RT [PAGE 111] Atlas vehicles are fueled by a mixture of liquid oxygen and kerosene RP-1 The latest HAS configuration also incorporates Castor IV A solid-rocket motors The early Atlas core vehicle included a sustainer verniers and two booster engines all ignited prior to liftoff In the Atlas II IIA and HAS vehicles the vernier engines have been replaced by a hydrazine roll-control system Of the four Castor SRBs on the HAS two are ground lit and two are air lit some 60 seconds later Atlas vehicles are now typically integrated with the Centaur upper stage vehicle that is fueled with liquid oxygen and liquid hydrogen Earlier flights used an Agena upper stage The entire Atlas history through 1995 is depicted rather compactly in bar-graph form in Figure 37 The solid-block portion of each bar indicates the number of launches during the calendar year for which vehicle performance was entirely normal in-so far as could be determined The clear white parts forming the tops of most bars show the number of launches that were either failures or flights where the launch vehicle experienced some sort of anomalous behavior Every launch with an entry in the response mode column in Table 41 falls in this category Such behavior did not necessarily prevent the attainment of some or even all mission objectives 50 i 45 on••••••---- 40 -l7.iFw1lre1Alomrui CJ Norrr,al P~rforrtjance 35 i uoo h••'l i•••••••••••n I I I I I I CJ 30 i i i i i CJ i i i i i 25 i i i i i t•••••••••U i 20 i i 15 I I I I 10 I I I 55 60 65 70 75 80 85 90 95 Launch Year Figure 37 Atlas Launch Summary 9/10/96 102 RTI [PAGE 112] 0.2.1 Atlas Launch History The data in Table 41 summarize the flight performance of all Atlas and Atlas-boosted space-vehicle launches since the program began in June 1957 A launch sequence number is provided in the first column a mission ID and launch date in columns and The vehicle configuration or Atlas booster number is given in the fourth column while the fifth column shows whether the launch took place from the Eastern or Western Range The last three columns in the table show respectively the response mode assigned by RTI to any failure or anomalous behavior that occurred the flight phase in which it occurred and whether the vehicle configuration is considered representative for the purposes of predicting future Atlas reliability Launches through sequence number 532 were used in the filtering process to estimate failure rate Table 41 Atlas Launch History No Mission/ID Launch Date Vehicle Test ConfKJuration Ranae ER ER Response Mode Flight Phase Rep Cont Weaoons Svstem WS ws 06/11/57 09/25/57 ws 12/17/57 12A ER ws 01/10/58 10A ER ws 02/07/58 13A ER ws 02120/58 11A ER ws 04/05/58 15A ER 10 ws ws ws 06/03/58 07/19/58 08/02168 16A ER 38 ER 48 ER 11 12 13 14 15 ws ws ws ws ws 08/28/58 09/14/58 09/18/58 11/17/58 11128/58 58 ER 88 ER 68 ER 98 ER 128 ER 2.5 2.5 16 SCORE 12/18/58 108 LV-3A/AGENA ER 17 18 19 20 21 22 ws ws ws ws ws ws 12123/58 01/15/59 01/27/59 02/04/59 02/20/59 03/18/59 ER 138 ER ER 118 ER ER ER 23 ws 04/14/59 ER 24 25 26 ws ws ws 05/18/59 06/06/59 07/21/59 70 ER ER SC ER 27 ws 07/28/59 11D ER 28 ws 08/11/59 14D ER 29 30 31 ws MERCURY test DESERT HEAT 08/24/59 09/09/59 09/09/59 11C ER 10D LV-38 ER 12D WR 9/10/96 103 RTI [PAGE 113] 32 33 34 35 36 37 38 39 40 41 42 43 44 45 46 47 48 49 50 51 52 53 54 55 56 57 58 59 60 61 62 63 64 65 66 67 68 69 70 71 72 73 74 75 76 77 No Mission/ID Launch Date Vehicle Confiauration Test Ranae Response Mode Flight Phase Rep Conf ws 09/16/59 17D ER 2.5 ws 10/06/59 18D ER ws 10/09/59 22D ER ws 10/29/59 26D ER 2.5 ws 11/04/59 28D ER NA ws 11/24/59 15D ER NA 2.5 ABLE PIONEER 11/26/59 20D LV-3A/AGENA ER ws 12/08/59 310 ER ws 12/18/59 40D ER ws 01/06/60 43D ER ws 01/26/60 440 ER DUAL EXHAUST 01/26/60 WR 2&2.5 ws 02/11/60 49D ER MIDASI 02/26/60 290 LV-3A/AGENA A ER 2.5 ws 03/08/60 42D ER 2.5 ws 03/10/60 510 ER ws 04/07/60 48D ER QUICK START 04/22/60 25D WR LUCKY DRAGON 05/06/60 230 WR ws 05/20/60 560 ER MIOASII 05/24/60 45D LV-3A/AGENAA ER ws 06/11/60 540 ER ws 06/22/60 62D ER 2.5 ws 06/27/60 270 ER ws 07/02/60 60D ER TIGER SKIN 07/22/60 74D WR MERCURY1 07/29/60 SOD LV-3B ER ws 08/09/60 32D ER ws 08/12/60 660 ER GOLDEN JOURNEY 09/12/60 470 WR ws 09/16/60 760 ER ws 09/19/60 79D ER ABLE PIONEER 09/25/60 800 LV-3A/AGENA ER 2.5&3 HIGH ARROW 09/29/60 33D WR ws 10/11/60 SE ER Gibson Girl 10/11/60 57D LV-3A/AGENA A WR NA 3&5 DIAMOND JUBILEE 10/12/60 81D WR ws 10/13/60 710 ER ws 10/22/60 55D ER ws 11/15/60 83D ER ws 11/29/60 ER ABLE PIONEER 12/15/60 91 LV-3A/AGENA EA HOT SHOT 12/16/60 99D WR ws 01/23/61 90D ER ws 01/24/61 BE ER Jawhawk Jamboree 01/31/61 70D LV-3A/AGENAA WR NA 9/10/96 104 RTI [PAGE 114] 78 79 80 81 82 83 84 85 86 87 88 89 90 91 92 93 94 95 96 97 98 99 100 101 102 103 104 105 106 107 108 109 110 111 112 113 114 115 116 117 118 119 120 121 122 123 No Mission/ID Launch Date Vehicle Confiauration Test Ranae Response Mode Flight Phase Rep Conf MERCURY2 02/21/61 67D LV-38 ER ws 02/24/61 ER ws 03/13/61 13E ER ws 03/24/61 16E ER 1.5 MERCURY3 04/25/61 100D LV-38 ER ws 05/12/61 12E ER LITTLE SATIN 05/24/61 95D WR ws SURE SHOT 05/26/61 06/07/61 18E 27E ER WR ws 06/22161 17E ER ws 07/06/61 22E ER Polar Orbit Midas Ill 07/12/61 97D LV-3A/AGENA WR ws 07/31/61 21E ER ws 08/08/61 ER NEW NICKEL 08/22/61 1010 WR RANGER 08/23/61 111 LV-M{AGENA ER NA ws 09/08/61 26E ER First Motion Samos Ill MERCURY4 ws 09/09/61 09/13/61 10/02/61 106D LV-3A/AGENA 88D LV-38 25E WR ER ER ws Big Town Midas IV ws 10/05/61 10/21/61 11/10/61 30E 105D LV-3A/AGENA 32E ER WR ER NA RANGER2 ws Round Trip Samos IV 11/18/61 11/22161 11/22/61 117D LV-3A/AGENA 108D LV-3A/AGENA ER ER WR NA MERCURY5 BIG PUSH ws 11/29/61 11/29/61 12/01/61 93D LV-38 53D 35E ER WR ER BIG CHIEF ws ws ws 12/07/61 12/12/61 12/19/61 12/20/61 82D SF 36E WR ER ER ER Ocean Wav Samos 12/22/61 114D LV-3A/AGENA WR NA BLUE FIN 01/17/62 123D WR BLUE MOSS 01/23/62 132D WR RANGER3 ws BIG JOHN MERCURY6 01/26/62 02/13/62 02/16/62 02/20/62 121D LV-3A/AGENA 40E 137D 1090 LV-3B ER ER WR ER NA NA 2&5 1.5 CHAIN SMOKER 02/21/62 52D WR SILVER SPUR 02/28/62 66E WR 1.5 Loose Tooth 03/07/62 1120 LV-3A/AGENAB WR CURRY COMB I 03/23162 134D WR ws Night Hunt 04109/62 04/09/62 11F 11 OD LV-3A/AGENA ER WR NA 9/10/96 105 [PAGE 115] 124 125 126 127 128 129 130 131 132 133 134 135 136 137 138 139 140 141 142 143 144 145 146 147 148 149 150 151 152 153 154 155 156 157 158 159 160 161 162 163 164 165 166 167 168 169 Flight Rep No Mission/ID Date Conflauration Test Response Launch Vehicle Cont CURRY COMB II 04/11/62 129D Phase Ranae Mode RANGER4 04/23/62 133D LV-3A/AGENA WR Daintv Doll 04/26/62 118D LV-3A/AGENA ER BLUE BALL 04/2.7/62 140D WR AC-1 SUBORBITAL 05/08/62 1040 LV-3C/CENT ER WR CANNONBALL FL YER 05/11/62 127D WR MERCURY7 05/24/62 1070 LV-3B ER Rubber Gun 06/17/62 115D LV-3A/AGENA WR ALLJAZl 06/26/62 21D WR LONG LADY 07/12/62 1410 WR EXTRA BONUS 07/13/62 67E WR 2&2.5 Armored Car 07/18/62 1200 LV-3A/AGENA WR FIRST TRY 07/19/62 130 WR MARINER VENUS 07/22/62 145D LV-3A/AGENA ER HIS NIBS 08/01/62 15F WR Air Scout 08/05/62 1240 LV-3A/AGENA WR PEGBOARD 08/09/62 WR PEGBOARD II 08/09/62 870 WR 2.5 CRASH TRUCK 08/10/62 57F WR ws 08/13/62 ER MARINER VENUS 08/27/62 1790 LV-3A/AGENA ER NA ws 09/19/62 SF ER BRIAR STREET 10/02/62 40 WR MERCURYS 10/03/62 113D LV-3B ER RANGERS 10/18/62 2150 LV-3A/AGENA ER NA ws 10/19/62 14F ER CLOSED CIRCUITS 10/26/62 1590 WR ws 11/07/62 16F ER After Deck 11/11/62 1280 LV-3A/AGENA WR ACTION TIME 11/14/62 13F WR ws 12/05/62 21F ER DEER PARK 12/12/62 161D WR Bargain Counter 12/17/62 1310 LV-3A/AGENA WR OAKTREE 12/18162 64E WR FLY HIGH 12/22162 160D WR BIG SUE 01/25/63 390 WR FAINT CLICK 01/31/63 1760 WR FLAG RACE 02/13/63 1820 WR PITCH PINE 02/28/63 1880 WR ABRES-1 03/01/63 134F TALL TREE3 03/09/63 1020 ER WR TALL TREE2 03/11/63 640 WR TALL TREE 03/15/63 460 WR TALL TREES 03/15/63 63F WR LEADING EDGE 03/16/63 193D WR KENDALL GREEN 03/21/63 83F WR 2.5 9/10/96 106 RTI [PAGE 116] 170 175 180 185 190 195 200 205 210 215 No Mission/ID Launch Date Vehicle Conflauration Test Ranae Response Mode Flight Phase Rep Cont TALL TREE4 03/23/63 52F WR 171 BLACK BUCK 04/24/63 65E WR NA 2.5 172 ABRES-2 04/26/63 135F ER 173 DamoClav 05/09/63 119D LV-3A/AGENA WR 174 MERCURY9 05/15/63 130D LV-3B ER DOCK HAND 06/04/63 62E WR 176 HARPOON GUN 06/12/63 198D WR Bia Four 06/12/63 139D LV-3A/AGENA WR 178 GO BOY 07/03/63 69E WR 179 Fish Pool 07/12/63 2010 LV-3A/AGENA WR OamoDuck 07/18/63 75D LV-3A/AGENA WR 181 SILVER DOLL 07/26/63 24E WR 182 BIG FLIGHT 07/30/63 70E WR 183 COOL WATER I 07/31/63 143D WR 184 PIPE DREAM 08/24/63 72E WR COOL WATER 11 08/28163 142D WR 186 Fixed Fee 09/06/63 212D LV-3A/AGENA WR 187 COOL WATER 111 09/06/63 63D WR 188 COOL WATER IV 09/11/63 84D WR 2.5 189 FILTER TIP 09/25/63 71E WR HOTRUM 10/03/63 45F WR 191 COOLWATERV 10/07/63 1630 WR 192 VELA 10/16/63 197D LV-3A/AGENA ER 193 HavBailer 10/25/63 224D LV-3A/AGENA WR 194 ABRES-3 10/28163 136F ER HICKORY HOLLOW 11/04/63 232D WR 196 COOL WATER VI 11/13/63 158D WR 197 AC-2 11/27/63 1260 LV-3C/CENTAUR ER 198 LENS COVER 12/18163 2330 WR 199 Rest Easy 12/18163 227D LV-3A/AGENA WR OAYBOOK 12/18/63 109F WR 201 RANGERS 01/30/64 1990 LV-3A/AGENA ER 202 BLUE BAY 02/12/64 48E WR 203 Uooer Octane 02/25/64 2850 LV-3A/AGENA WR 204 ABRES-4 02/25/64 ER Ink Blotter 03/11/64 2960 LV-3A/AGENA WR 206 ABRE5-5 04/01/64 137F ER 207 HIGHBALL 04/03/64 WR 208 PROJECT FIRE 04/14/64 263D LV-3A/AGENA ER 209 Anchor Dan 04/23/64 351D LV-3A/AGENA WR Big Fred 05/19/64 3500 LV-3A/AGENA WR 211 IRON LUNG 06/18/64 2430 WR 212 AC-3 06/30/64 1350,LV-SC/CENT.D ER 213 Quarter Round 07/06/64 3520 LV-3A/AGENA WR 214 VELA3 07/17/64 2160 LV-3A/AGENA ER RANGER7 07/28/64 2500 LV-3A/AGENA ER 9/10/96 107 RTI [PAGE 117] 216 217 218 219 220 221 222 223 224 225 226 227 228 229 230 231 232 233 234 235 236 237 238 239 240 241 242 243 244 245 246 247 248 249 250 251 252 253 254 255 256 257 258 259 260 261 No Mission/ID Launch Date Vehicle Confiauration Test Range Response Mode Flight Phase Rep Cont KNOCK WOOD 07/29/64 248D WR LARGE CHARGE 08/07/64 110F WR Big Sickle 08/14/64 7101 SLV-3A/AGENA WR GALLANT GAL 08/27/64 57E WR BIG DEAL 08/31/64 36F WR OG0-1 09/04/64 1950 LV-3A/AGENA ER BUTTERFLY NET 09/15/64 2450 WR BUZZING BEE 09/22/64 247D WR Slow Pace 09/23/64 7102 SLV-3/AGENA WR Busy Line 10/08/64 7103 SLV-3/AGENA WR Boon Decker 10/23/64 3530 LV-3A/AGENA WR MARINERS 11/05/64 289D LV-3A/AGENA ER MARINER4 11/28/64 2880 LV-3A/AGENA ER BROOK TROUT 12/01/64 2100 WR OPERA GLASS 12/04/64 300D WR Battle Royal 12/04/64 7105 SLV-3/AGENA WR AC-4 12/11/64 1460 LV-3C/CENTAUR ER STEP OVER 12/22/64 111F WR PILOT LIGHT 01/08/65 106F WR PENCIL SET 01/12/65 1660 WR Beaver's Dam 01/21/65 172D/ABRES WR 2&3 Sand Lark 01/23/65 7106 SLV-3/AGENA WR RANGERS 02/17/65 196D LV-3A/AGENA ER DRAG BAR 02/27/65 2110 WR PORK BARREL 03/02/65 301D WR Ac-5 03/02/65 1560 LV-3C/CENT ER ShioRail 03/12/65 7104 SLV-3/AGENA WR ANGEL CAMP 03/12/65 154D WR RANGER9 03/21/65 2040 LV-3A/AGENA ER FRESH FROG 03/26/65 297D WR AirPumo 04/03/65 7401 SLV-3/AGENA WR FLIP SIDE 04/06/65 150D WR Dwarf Tree 04/28/65 7107 SLV-3/AGENA WR PROJECT FIRE 05/22/65 264D LV-3A/AGENA ER Bottom Land 05/27/65 7108 SLV-3/AGENA WR Tennis Match 05/27/65 68D/ABRES WR OLD FOGEY 06/03/65 1770 WR LEA RING 06/08/65 299D WR STOCK BOY 06/10/65 302D WR Worn Face 06/25/65 7109 SLV-3/AGENA WR BLIND SPOT 07/01/65 59D WR White Pine 07/12/65 7112 SLV-3/AGENA WR 4&5 2&3 VELA 07/20/65 225D LV-3A/AGENA ER Water Tower 08/03/65 7111 SLV-3/AGENA WR PIANO WIRE 08/04/65 183D WR SEA TRAMP 08/05/65 147F WR 9/10/96 108 RTI [PAGE 118] 262 263 264 265 266 267 268 269 270 271 272 273 274 275 276 277 278 279 280 281 282 283 284 285 286 287 288 289 290 291 292 293 294 295 296 297 298 299 300 301 302 303 304 305 306 307 No Mission/ID Launch Date Vehicle Confiauration Test Ranae Response Mode Flight Phase Rep Cont AC-6 08/11/65 151D LV-3C/CENTAUR ER TONTO RIM 08/26/65 61D WR WATER SNAKE Log Fog Seethina Citv GTV-6 Shop Degree 09/29/65 09/30/65 125D 7110 SLV-3/AGENA WR WR 10/05/65 10/25/65 11/08/65 11/29/65 12/20/65 34D/ABRES 5301 SLV-3/AGENA 7113 SLV-3/AGENA 200D 85D WR ER WR WR WR WILD GOAT TAG DAY Blanket Partv YEAST CAKE 01/19/66 02/10/66 02/11/66 02/15/66 02/19/66 7114 SLV-3/AGENA 305D 86D 7115 SLV-3/AGENA 73D WR WR WR WR WR LONELY MT Mucho Grande SYCAMORE RIDGE ETERNAL CAMP 03/04/66 303D WR GTV-8 03/16/66 5302 SLV-3/AGENA ER Dumb Dora 03/18/66 7116 SLV-3/AGENA WR WHITEBEAR 03/19/66 304D WR Bronze Bell AC-8 OA0-1 Shallow Stream CRAB CLAW SUPPLY ROOM Pump Handle GTV-9 SAND SHARK SURVEYOR-1 AC-10 GTV-9A Power Drill OGO-3 Mama's Boy VENEER PANEL 03/30/66 04/07/66 04/08/66 04/19/66 05/03/66 05/13/66 05/14/66 05/17/66 72D 184D LV-3C/CENT 5001 SLV-3/AGENA 7117 SLV-3/AGENA 208D 98D 7118 SLV-3/AGENA 5303 SLV-3/AGENA WR ER ER WR WR WR WR ER 05/26/66 05/30/66 06/01/66 06/03/66 06/06/66 06/09/66 06/10/66 410 290D LV-3C/CENTAUR 5304 SLV-3/AGENA 7119 SLV-3/AGENA 5601 SLV-3/AGENA 7201 SLV-3/AGENA 960 WR ER ER WR ER WR WR 2.5 GOLDEN MT HEAVY ARTILLERY Snake Creek 06/26/66 06/30/66 07/12/66 1470 298D 7120 SLV-3/AGENA WR WR WR Stonv Island 07/13/66 580/ABRES WR NA GTV-10 07/18/66 5305 SLV-3/AGENA ER BUSY RAMROD 08/08/66 149F WR LUNAR ORBITER 08/10/66 5801 SLV-3/AGENA ER Silver Doll 08/16/66 7121 SLV-3/AGENA WR Haoov Mt 08/19/66 7202 SLV-3/AGENA WR GTV-11 Taxi Driver 09/12/66 09/16/66 5306 SLV-3/AGENA 7123 SLV-3/AGENA ER WR NA SURVEYOR AC-7 Dwarf Killer 09/20/66 10/05/66 1940 LV-3C/CENT 7203 SLV-3/AGENA ER WR 9/10/96 109 RTI [PAGE 119] 308 309 310 311 312 313 314 315 316 317 318 319 320 321 322 323 324 325 326 327 328 329 330 331 332 333 334 335 336 337 338 339 340 341 342 343 344 345 346 347 348 349 350 351 352 353 No Mission/ID Launch Date Vehicle Conflauration Test Ranae Response Mode Flight Phase Rep Cont LOWHILL 10/11/66 115F WR Gleamina Star 10/12/66 7122 SLV-3/AGENA WR AC-9 10/26/66 174D LV-3C/CENT ER NA Red Caboose 11/02/66 7124 SLV-3/AGENA WR LUNAR ORBITER 11/06/66 5802 SLV-3/AGENA ER GTV-12 11/11/66 5307 SLV-3/AGENA ER Busv Mermaid 12/05/66 7125 SLV-3/AGENA WR ATS-S 12/06/66 5101 SLV-3/AGENA ER BusvPanama 12/11/66 89O/ABRES WR Busv Peacock 12/21/66 7001 SLV-3/AGENA WR BUSY STEPSON 01/17/67 148F WR NA 2.5 BUSY NIECE 01/22/67 350 WR Busv Party 02/02/67 7126 SLV-3/AGENA WR LUNAR ORBITER 02/04/67 5803 SLV-3/AGENA ER BUSY BOXER 02/13/67 121F WR Giant Chief 03/05/67 7002 SLV-3/AGENA WR LITTLE CHURCH 03/16/67 151F WR ATS-A 04/05/67 5102 SLV-3/AGENA ER BUSY SUNRISE 04/07/67 38D WR SURVEYOR AC-12 04/17/67 2920 LV-3C/CENTAUR ER Busv Tournament 04/19/67 7003 SLV-3/AGENA WR LUNAR ORBITER 05/04/67 5804 SLV-3/AGENA ER BUSY PIGSKIN 05/19/67 119F WR BusvCamoer 05/22/67 7127 SLV-3/AGENA WR BusvWolf 06/04/67 7128 SLV-3/AGENA WR BUCKTYPE 06/09/67 122F WR MARINER VENUS 06/14/67 5401 SLV-3/AGENA ER ABRES AFSC 07/06/67 650 WR SURVEYOR AC-111 07/14/67 2910 LV-3C/CENTAUR ER ABRES AFSC 07/22/67 114F WR AFSC 07/27/67 92D/ABRES WR BREAD HOOK 07/29/67 150F WR LUNAR ORBITER 08/01/67 5805 SLV-3/AGENA ER SURVEYOR AC-13 09/08/67 5901C SLV-3/CENTAUR ER ABRES AFSC 10/11/67 690 WR ABRES AFSC 10/14/67 118F WR ABRES AFSC 10/27/67 81F WR ATS-C 11/05/67 5103 SLV-3/AGENA ER SURVEYOR AC-14 11/07/67 5902C SLV-3C/CENTAUR ER ABRES AFSC 11/07/67 94D WR ABRES AFSCl 11/10/67 113F WR ABRES AFSC 12/21/67 117F WR SURVEYOR AC-15 01/07/68 5903C SLV-3C/CENTAUR ER ABRES AFSCl 01/31/68 94F WR ABRES AFSC 02/26/68 116F WR OGO-E 03/04/68 5602A SLV-3A/AGENA ER 9/10/96 110 RTI [PAGE 120] No Mission/ID Launch Date Vehicle Confiauration Test Ranae Response Mode Flight Phase Rep Conf 354 ABRES AFSC 03/06/68 74E WR 355 AFSC 04/06/68 107F/ABRES WR 356 ABRES AFSC 04/18/68 77E WR 357 ABRES AFSC 04/27/68 78E WR 358 ABRES AFSC 05/03/68 95F WR 359 ABRES AFSC 06/01/68 89F WR 360 ABRES AFSC 06/22/68 86F WR 361 ABRES AFSC 06/29/68 32F WR 362 AFSC 07/11/68 75F/ABRES WR 363 DOD AA-27 08/06/68 SLV-3A/AGENA ER 364 ATS-D AC-17 08/10/68 5104C SLV-3C/CENTAUR ER NA 365 AFSC 08/16/68 7004 SLV-3/BURNER II WR 366 ABRES AFSC 09/25/68 99F WR 367 ABRES AFSC 09/27/68 84F WR 368 ABRES AFSC 11/16/68 56F WR 2.5 369 ABRES AFSC 11/24/68 60F WR 370 OAO-A2 AC-16 12/07/68 5002C SLV-3O/CENTAUR ER 371 ABRES AFSC 01/16/69 70F WR 372 MARINER MARS AC-20 02/24/69 54030 SLV-3C/CENTAUR ER NA 373 AFSC 03/17/69 104F/ABRES WR 374 MARINER MARS AC-19 03/27/69 5105C SLV-3C/CENTAUR ER 375 DOD AA-28 04/12/69 SLV-3A/AGENA ER 376 ATS-E AC-18 08/12/69 54020 SLV-3C/CENTAUR ER 377 ABRES AFSC 08/20/69 112F WR 378 ABRES AFSC 09/16/69 100F WR 379 ABRES AFSC 10/10/69 98F WR 380 ABRES AFSC 12/03/69 44F WR 381 ABRES AFSC 12/12/69 93F WR 382 ABRES AFSC 02/08/70 96F WR 383 ABRES AFSC 03/13/70 28F WR 384 ABRES AFSC 05/30/70 91F WR 385 ABRES AFSC 06/09/70 92F WR 386 DOD AA-29 06/19/70 SLV-3A/AGENA ER 387 DOD AA-30 08/31/70 SLV-3A/AGENA ER 388 OA0-8 AC-21 11/30/70 50030 SLV-3O/CENTAUR ER 389 ABRES AFSC 12/22/70 105F WR 390 INTELSAT IV AC-25 01/25171 50050 SLV-3O/CENTAUR ER 391 ABRES AFSC 04/05/71 85F WR 392 MARINER MARS AC-24 05/08/71 5405C SLV-3O/CENTAUR ER 393 MARINER MARS AC-23 05/30/71 5404C SLV-3O/CENTAUR ER 394 ABRES AFSC 06/29/71 103F WR 395 AFSC 08/06/71 76F WR 396 ABRES AFSC 09/01/71 74F WR 397 DOD AA-31 12/04/71 SLV-3NAGENA ER 398 INTELSAT IV AC-26 12/19171 50060 SLV-3C/CENTAUR ER 399 INTELSAT IV AC-28 01/22/72 50080 SLV-3O/CENTAUR ER 9/10/96 111 RTI I [PAGE 121] 400 401 402 403 404 405 406 407 408 409 410 411 412 413 414 415 416 417 418 419 420 421 422 423 424 425 426 427 428 429 430 431 432 433 434 435 436 437 438 439 440 441 442 443 444 445 Flight Rep No Response Launch Test Vehicle Conf PIONEER 10 AC-2n Phase Mode Mission/ID Conflauration Ranae Date INTELSAT IV AC-29 50070 SLV-3C/CENTAUR ER 03/02/72 ER 50090 SLV-3C/CENTAUR 06/13/72 AFSC OAO-C{AC-22 50040 SLV-30/CENTAUR ER 08/21n2 DOD AA-32 10/02/72 102F/BURNER II WR SLV-3A/AGENA DOD AA-33 1212on2 ER PIONEER 11 AC-30 ER 03/06/73 SLV-3A/AGENA INTELSAT IV AC-31 ER 5011D SLV-3D/CENT D-1A 04/05/73 ABRES AFSC ER 5010D SLV-3D/CENT D-1A 08/23/73 ACE 08/29n3 WR 78F MARINER 10 AC-34 09/30ll3 108F WR SFT-1 11/03/73 5014D SLV-3D/CENT D-1A ER ACE WR 03/06/74 73F SFT-2 WR 03/23/74 97F SFT-3 WR os101n4 54F NTS-1 06/28ll4 WR 82F ACE 07/13/74 WR 69F ABRES AFSC 09/08ll4 80F WR INTELSAT IV AC-32 10/12ll4 31F WR INTELSAT IV AC-33 5012D SLV-3D/CENT D-1A ER 11121n4 AFSC ER 02/20ll5 5015D SLV-3D/CENT D-1A INTELSAT IV AC-35 04/12ll5 WR 71F DOD AA-34 05/22/75 5018D SLV-3D/CENT D-1A ER INTELSAT IVA AC-36 06/18ll5 SLV-3A/AGENA ER INTELSAT IVA AC-37 09/25ll5 5016D SLV-3D/CENT D-1A ER AFSC 01/29176 5017D SLV-3D/CENT D-1A ER WR COMSTAR AC-38 04/30ll6 COMSTAR AC-40 05/13ll6 5020D SLV-3D/CENT D-1A ER DOD(AA-35 07/22ll6 5022D SLV-3D/CENT D-1A ER INTELSAT IVA AC-39 05123m SLV-3A/AGENA ER NTS-2 5019D SLV-3D/CENT D-1A 05/26/77 ER HEAO-A AC-45 65F WR 06/23/Tl 08/12ll7 5025D SLV-3D/CENT D-1A ER AFSC INTELSAT IVA CAC-43 09129n1 57010 SLV-3D/CENT D-1A ER DOD AA-36 12108f17 WR 12111m SLV-3A/AGENA ER INTELSAT IVA AC-46 FLTSATCOM-A AC-44 01/06/78 50260 SLV-3D/CENT D-1A ER 02/09ll8 50240 SLV-3D/CENT D-1A ER NDS-1 INTELSAT IVA AC-48 02/22ll8 64F WR DOD AA-37 oa131n8 5028D SLV-3O/CENT D-1A ER NDS-2 SLV-3A/AGENA ER 04/07n8 05/13/78 49F PIONEER VENUS AC-SO WR SEASATA 05/20/78 50300 SLV-3D/CENT D-1A ER COMSTAR AG-41 06/26/78 23F/AGENA WR 06/29ll8 5021D SLV-3D/CENT D-1A ER PIONEER VENUS AC-51 ER NAVSTAR Ill 08/08n8 50310 SLV-3D/CENT D-1A 10/06ll8 47F WR 9/10/% 112 RTI [PAGE 122] 446 447 448 449 450 451 452 453 454 455 456 457 458 459 460 461 462 463 464 465 466 467 468 469 470 471 472 473 474 475 476 477 478 479 480 481 482 483 484 485 486 487 488 489 490 491 No Mission/ID Launch Date Vehicle Confiauration Test Ranae Response Mode Flight Phase Rep Cont TIROSN 10/13/78 29F WR HEAO-B A0-52 11/13/78 50320 SLV-3O/CENT D-1A ER NAVSTAR!V 12/10/78 39F WR STP-78-1 02/24/79 27F WR FLTSATCOM-B AC-4n 05/04/79 50270 SLV-3D/CENT D-1A ER NOAA-A 06/27/79 25F WR HEAO-C AC-53 09/20/79 5033D SLV-3D/CENT D-1A ER FLTSATCOM-C AC-49 01/17/80 50290 SLV-3D/CENT D-1A ER NAVSTARV 02/09/80 35F WR AFSC 03/03/80 WR NAVSTARVI 04/26/80 34F WR NOAA-B 05/29/80 19F WR NA FLTSATCOM-D A0-5n 10/31/80 5037D SLV-3D/CENT D-1A ER INTELSAT IV AC-54 12/06/80 5034D SLV-3D/CENT D-1A ER AFSC 12/08/80 68E WR COMSTAR AC-42 02/21/81 5023D SLV-3D/CENT D-1A ER INTELSAT Ao-56 05/23/81 5036D SLV-3D/CENT D-1A ER NOAA-C 06/23/81 87F WR FLTSATCOM-E AC-59 08/06/81 5039D SLV-3D/CENT D-1A ER NA 1&5 INTELSAT AC-55 12/15/81 5035D SLV-3D/CENT D-1A ER NAVSTARV!I 12/18/81 76E WR INTELSAT A0-58 03/05/82 5038D SLV-3D/CENT D-1A ER INTELSATV AC-60 09/28/82 50400 SLV-3D/CENT D-1A ER DMSP 12/20/82 60E WR AFSC 02/09/83 WR NOAA-E 03/28/83 73E WR INTELSAT AO-S1 05/19/83 50410 SLV-3D/CENT D-1A ER AFSC 06/09/83 WR NAVSTAR VIII 07/14/83 75E/PAM-D WR DMSP 11/17/83 58E WR AFSC 02/05/84 WR INTELSAT AC-62 06/09/84 5042G/CENT D-1A ER NAVSTARIX 06/13/84 42E/PAM-D WR NAVSTARX 09/08/84 14E/PAM-D WR NOAA·F 12/12/84 39E WR GEOSTA-A 03/12/85 41E WR INTELSATV F-10 Ao-63 03/22185 5043G/CENT D-1A ER INTELSATV F-11 AC-64 06/30/85 5044G/CENT D-1A ER INTELSATV F-12 AC-65 09/28/85 5045G/CENT A ER NAVSTARXI 10/08/85 55E WR AFSC 02/09/86 WR NOAA-G 09/17/86 52E WR FLTSATCOM AC-66 12/05/86 5046G/CENT D-1A ER FL TSATCOM AC-67 03/26/87 5048G/CENT D-1A ER AFSC 05/15/87 WR DMSP 06/19/87 59E WR 9/10/96 113 RTI [PAGE 123] 492 493 494 495 496 497 498 499 500 501 502 503 504 505 506 507 508 509 510 511 512 513 514 515 516 517 518 519 520 521 522 523 524 525 526 527 528 529 530 531 532 533 534 535 Flight Rep Vehicle Test Response Launch Phase Conf No Mission/ID Date Confiauration Range Mode DMSP 02/02/88 54E WR NOAA·H 09/24/88 63E WR FLTSATCOM AC-68 09/25/89 5047G/CENT D-1A ER P87-2 04/11/90 28E/ALT3A WR CARES AC-69 07/25/90 5049 I/CENT I ER DMSS10 12/01/90 61E WR BS-3H COMSAT AC-70 04/18/91 5050 I/CENT I ER NOAA-D 05/14/91 SOE WR DMSP F-11 11/28/91 53E WR EUTELSAT AC-102 12/07/91 810211/CENT I ER DSCS Ill AC 01 02/11/92 8101 II/CENT I ER GAIJJ.XY AC-72 03/14/92 50521/CENT ER INTELSAT AC-105 06/10/92 8105 IIA/CENT ER DSCS 111 AC-103 07/02/92 810311/CENT ER GAIJJ.XY AC-71 08/22/92 50511/CENT ER UHF FOLLOW ON-1 AC-74 03/25/93 50541/CENT ER NA 2&5 DSCS Ill AC-104 07/19/93 810411/CENT ER NOAA-I 08/09/93 34E WR UHF F/O-2 AC-75 09/03/93 50551/CENT ER DSCS 111 AC 106 11/28193 8106 II/CENT ER TELSTAR AC-108 12/16/93 8201 IIAS/CENT ER GOES-1 AC-73 04/13/94 50531/CENT ER UHF F/0-3 AC-76 06/24/94 50561/CENT ER DIRECT TV AC-107 08/03/94 8107 IIA/CENT ER DMSP F-12 08/29/94 20E WR INTELSAT VII AC-111 10/06/94 8202 IIAS/CENT ER ORION AC-110 11/29/94 8109 IIA/CENT ER NOAA-J 12/30/94 11E WR INTELSAT 704-2 AC-113 01/10/95 8203 HAS/CENT ER EHF F/O-4 AC-112 01/29/95 8110 II/CENT ER INTELSAT VII AC-115 03/22/95 8204 HAS/CENT ER DMSP F-13 03/24/95 45E WR MSAT(AC-114 04/07/95 8111 IIA/CENT ER GOEs-J AC-77 05/23/95 I/CENT ER EHF F/O-5 AC-116 05/31/95 II/CENT ER DSCS Ill AC-118 07/31/95 IIA/CENT ER JCSAT AC-117 08/29/95 HAS/CENT ER EHF F/O-6 AC-119 10/22/95 II/CENT ER SOLAR OBSERV AC-121 12/02/95 IIAS/CENT ER GALAXY IIIR AC-120 12/15/95 IIA/CENT ER PALAPA-C AC-126 01/31/96 IIAS/CENT ER INMARSAT-3 AC-122 04/03/96 IIA/CENT ER SP-:1 AC-78 04/30/96 I/CENT ER UHF AC-125 07/25/96 II/CENT ER 9/10/96 114 RTI [PAGE 124] D.2.2 Atlas Failure Narratives The following narratives provide the available details about each Atlas failure since the beginning of the Atlas program The narratives are numbered to match the flight- sequence numbers in Section D.2.1 11 June 57 Response Mode Flight Phase Flight appeared normal for 24.7 seconds when drop in fuel supply to engine produced a drop in performance and shutdown Both engines moved to hardover in pitch to compensate for thrust asymmetry The Bl engine failed at 27 seconds A fuel fire was observed in aft end after thrust was lost The missile continued to rise reaching an altitude of 9,800 feet at 38 seconds Missile was destroyed by safety officer 50.1 seconds after liftoff Thrust unit and other hardware impacted about mile south of launch pad 105° flight azimuth 25 Sep 57 Response Mode Flight Phase Flight appeared normal until about 32.5 seconds after liftoff when performance level of both engines dropped to 35% of normal Both engines shut down at 37 seconds Missile was destroyed at 63 seconds Loss of thrust was due to loss of LOX regulator in the booster gas generator Major components impacted about 8000 feet downrange and 1000 feet right of flight line 13A Feb 58 Response Mode Flight Phase The turbopump and engine stopped operating about 118 seconds due either to loss of 10 regulator reference pressure or a control-system failure The Bl engine ceased to operate 0.3 second later Failure was attributed to shorting of a vernier engine feedback transducer due to aerodynamic heating Propellant sloshing that began building up at about 100 seconds led to missile instability Vehicle broke up at 167 seconds Impact occurred about 280 miles downrange and about miles crossrange llA 20 Feb 58 Response Mode Flight Phase Vernier engine was hardover from 51.9 seconds to 89.4 seconds then returned to null until 104 seconds then went hardover again Other systems appeared normal until 109.6 seconds when divergent oscillations began in rate-gyro outputs and engine positions All engines reached stops by 114.3 seconds and continued thereafter to oscillate between stops until loss of thrust at 124.8 seconds Vehicle breakup occurred one second later Probable cause of oscillation was a component failure in flight control system Vehicle impacted about 105 miles downrange and miles right of flight line 15A Apr 58 Response Mode Flight Phase Booster engines shut down prematurely at 105.3 seconds instead of planned 127 seconds due to Bl turbopump failure Since Bl chamber pressure drives the gas generator the turbopump and engine also stopped Impact was 180 miles downrange and slightly left of flight line 9/10/96 115 RTI [PAGE 125] 19 July 58 Response Mode Flight Phase Random failure of yaw rate gyro caused violent maneuvers resulting in rupture of LO tank engine shutdown and a fire near the lube oil drain Missile broke up about 42 seconds with impact about miles downrange and 0.4 miles crossrange left 11 SB 28 Aug 58 Response Mode Flight Phase 2.5 Missile was normal to SECO After SECO failure of hydraulic system caused loss of vernier engine control Warhead impacted close to intended target 12 BB 14 Sep 58 Response Mode Flight Phase 2.5 Warhead impacted close to target although control was lost after SECO due to failure of vernier-engine hydraulic system 13 18 Sep 58 Response Mode Flight Phase Except for a late-opening sustainer fuel valve flight was apparently normal until 80.8 seconds when the Bl turbopump failed Performance of the Bl engine and the axial acceleration dropped sharply at about 81.7 seconds and the system shut down about 0.1 seconds later The sustainer and vernier engines continued to operate normally until 82.9 seconds when the missile exploded Impact was about 25 miles downrange and about 0.6 miles right of the flight line 14 17 Nov 58 Response Mode Flight Phase The flight was terminated at 227.6 seconds by premature fuel depletion caused either by failure of the propulsion utilization system or by a tanking error Missile impacted near the flight line about 2300 miles downrange some 850 miles short of target 18 13B 15 Jan 59 Response Mode Flight Phase The vehicle appeared normal for the first 50-60 seconds at which time it was obscured by clouds It was probably normal until about 100 seconds but prelaunch removal of the mainframe telemetry system prevented a precise determination Beginning about 101 seconds various erratic pitch yaw and roll rates and oscillations were noted with accompanying drops in acceleration and velocity These rates become excessive at 106.6 seconds At 121 seconds the nosecone telemetry system showed that yaw and pitch rates abruptly increased and this condition existed until reentry at 281 seconds All thrusting apparently stopped between 121 and 123 seconds The missile impacted about 170 miles downrange and 7.5 miles left 19 27 Jan 59 Response Mode Flight Phase Since the guidance system was inoperative throughout the flight path was controlled by the pre-programmed flight control system Impact was about 80 miles long and 30 miles left of target point 21 SC 20 Feb 59 Response Mode Flight Phase After a normal booster phase missile exploded at 173 seconds BECO at 149.2 sec apparently due to loss of fuel- tank pressure and subsequent rupture of LOX fuel-tank bulkhead Impact was about 1000 miles downrange and miles left 9/10/96 116 RTI [PAGE 126] 22 18 Mar 59 Response Mode Flight Phase Booster engines shut down prematurely at 129.4 seconds but booster section was not jettisoned until the near- normal time of 153 seconds Guidance was inoperative Since the sustainer engine could not gimbal before booster separation the autopilot was unable to stabilize the missile after BECO The sustainer shut down about 40 seconds before propellant depletion The reentry vehicle spin rockets fired prematurely at 86.3 seconds after liftoff 23 14 Apr 59 Response Mode Flight Phase Performance of engine dropped 36% at launch resulting in a violent pitch as missile left the launcher Flight control system corrected missile attitude and flight continued at reduced thrust until a more violent explosion tore the thrust section away from the missile at 26.1 seconds The sustainer continued operating with decreased thrust until shutdown by the safety officer at 36 seconds Debris impacted about 3000 feet from launch point 24 18 May 59 Response Mode Flight Phase Failure in pneumatic system resulted in missile explosion at 65 seconds A temporary failure of the thrust- structure fairing at liftoff strained the pneumatic lines and disconnects resulting in leaks in the pneumatic system 25 June 59 Response Mode Flight Phase Either structural damage at booster staging or failure of the booster staging valve to dose resulted in a fuel leak and explosion at 159.3 seconds Impact occurred near the flight line about 780 miles downrange 30 10D Mercury Sep 59 Response Mode Flight Phase Booster section failed to jettison resulting in a final velocity about 3000 ft sec low and an impact range about 500 miles short of target 32 17D 16 Sep 59 Response Mode Flight Phase 2.5 Flight was considered a success since impact was within two miles of target point However failure of the vernier hydraulic package resulted in loss of missile control during the vernier solo phase 35 26D 29 Oct 59 Response Mode Flight Phase 2.5 Vernier solo phase was unstable in pitch·due to loss of thrust from vernier engine The engine lost chamber pressure during booster jettison Impact was about 14 miles short and out of splash net 36 28D Nov 59 Response Mode NA Flight Phase The flight was normal but was terminated prematurely when the range-safety impact-predictor system failed 37 15D 24 Nov 59 Response Mode NA Flight Phase 2.5 Flight was normal except the reentry vehicle failed to arm or separate 9/10/96 117 RTI [PAGE 127] 38 20D Able 26 Nov 59 Response Mode Flight Phase Third and fourth stages and payload broke off about 47 seconds Atlas flight was normal and second stage ignited properly after Atlas SECO 43 Dual Exhaust 26 Jan 60 Response Mode Flight Phase and 2.5 At 175 seconds as a result of a full-scale positive yaw command generated for five seconds the missile stabilized on an erroneous heading When a range-rate flag was lost 20 seconds later the differentiated range-rate data substituted for measured data corrected the erroneous azimuth by generating a full-scale negative yaw command The substituted data resulted in slightly erratic steering and a premature VECO signal that was not acted upon The verniers were subsequently cutoff by the backup signal 45 29D Midas I 26 Feb 60 Response Mode Flight Phase 2.5 Flight was normal until firing of the retro rockets after Atlas separation An explosion at this time probably due to activation of the Agena inadvertent separation destruct system destroyed both the Atlas vehicle and the Agena 46 42D Mar 60 Response Mode Flight Phase 2.5 Flight was considered a success although failure of the vernier hydraulic system resulted in loss of attitude control during the vernier solo phase 47 51 10 Mar 60 Response Mode Flight Phase Due to combustion instability an explosion occurred in the Bl chamber before missile movement Missile was destroyed at 2.5 seconds after 2-inch motion when main propellants ignited 48 48D Apr 60 Response Mode Flight Phase Missile was destroyed in launch stand during launch attempt apparently due to combustion instability in the thrust chamber 50 23D Lucky Dragon May 60 Response Mode Flight Phase An inoperative pitch gyro caused pitch instability and resulted in destruct at 25.6 seconds 54 62D 22 June 60 Response Mode Flight Phase 2.5 Vernier engines were cutoff by autopilot backup when guidance discrete was not sent Impact was 18 miles long 56 60D July 60 Response Mode Flight Phase Depletion of helium bottle pressure led to low sustainer and vernier engine thrust and eventually early shutdown of engines Impact was 40 miles short of target 57 74D Tiger Skin 22 July 60 Response Mode Flight Phase A pitchover rate that was 69% above the nominal rate resulted in vehicle breakup at 69.2 seconds 9/10/96 118 RTI [PAGE 128] 58 SOD Mercury 29 July 60 Response Mode Flight Phase Flight appeared normal till 57.6 seconds when missile broke up apparently due to a rupture of the forward section of the LO tank 61 470 Golden Journey 12 Sep 60 Response Mode Flight Phase Flight was apparently normal until about 222 seconds when missile acceleration began to decay A LOX regulator failure caused low sustainer performance and insufficient velocity to reach target Impact was about 535 miles short 64 BOD Able V/Pioneer 25 Sep 60 Response Mode Flight Phase 2.5 and Atlas performed normally except for failure of vernier engines to cut off Flight was not successful since the Agena chamber pressure stabilized at 70% of normal shortly after ignition Stage then apparently tumbled before cutting off 30 seconds early Third-stage spun up and stabilized in a nose-down attitude 65 33D High Arrow 29 Sep 60 Response Mode Flight Phase The booster engines cut off prematurely and failed to separate from sustainer The missile remained intact but failed to achieve the desired range because of the added booster weight 66 11 Oct 60 Response Mode Flight Phase Sustainer hydraulic pressure began to decay at 41 seconds and dropped to zero at 62 seconds Sustainer began tumbling at booster staging when control was essentially lost Thrust continued for about 18 seconds moving the impact point some 270 miles farther downrange and 27 miles crossrange The missile exploded at 155 seconds 67 570 LV-3A Agena A Gibson Girl 11 Oct 60 Response Mode NA Flight Phase and Atlas performance was satisfactory An umbilical failed to release properly from the Agena at liftoff resulting in loss of pneumatic supply to the Agena attitude control system A satisfactory orbit was not achieved Guidance beacon failed at 106 seconds resulting in autopilot flight 68 81D Diamond Jubilee 12 Oct 60 Response Mode Flight Phase Overpressurization of the LOX tank resulted in tank rupture and vehicle breakup at 71.6 seconds 72 29 Nov 60 Response Mode Flight Phase Sustainer hydraulic pressure lost at 41 seconds Missile tumbled shortly after booster staging Sustainer thrust terminated at about 150 seconds some 22 seconds after BECO During the sustainer solo phase the impact point moved about 120 miles downrange and 44 miles crossrange 73 91D 15 Dec 60 Response Mode Flight Phase Vehicle performed normally till about 66.7 seconds when a blast-band failure apparently resulted in rupture of the forward section of the LOX tank The upper stages separated at this time but the Atlas engines continued thrusting until 71 seconds Control was lost between 9/10/96 119 RTI [PAGE 129] 72 and 73 seconds and a final explosion occurred at 74 seconds Impact was about miles downrange and one mile crossrange 76 SE 24 Jan 61 Response Mode Flight Phase Missile stability was lost at about 161 seconds some 30 seconds after BECO probably due to failure of the servo- amplifier power supply The sustainer engine shut down at 248 seconds and the vernier engines about 10 seconds later Impact occurred 1316 miles downrange and 215 miles crossrange 77 70D LV-3A Agena A Jawhawk Jamboree 31 Jan 61 Response Mode NA Flight Phase Flight was considered successful although loss of rate lock at 222 seconds caused slightly erratic steering during the last 20 seconds of Atlas sustainer thrusting flight and failure of vehicle to pitch over during the vernier solo period 80 13E 13 Mar 61 Response Mode Flight Phase Sustainer main fuel valve remained in the full open position throughout flight resulting in fuel depletion and premature shutdown of sustainer engine at 251 seconds 81 16E 24 Mar 61 Response Mode Flight Phase 1.5 Due to depletion of helium- bottle pressure booster section failed to jettison leading to fuel depletion and impact far short of target 82 100D Mercury 25 Apr 61 Response Mode Flight Phase Flight was terminated at 40 seconds by RSO when vehicle failed to perform roll and pitch- over maneuvers apparently due to failure of the autopilot programmer The malfunction was attributed to a plastic coating on the connector pins within the programmer causing an open circuit Major debris impacted about 1800 feet downrange and 6100 feet crossrange left 86 27E Sure Shot June 61 Response Mode Flight Phase Apparent combustion instability caused an explosion and missile destruction 3.86 seconds after liftoff 87 17E 22 June 61 Response Mode Flight Phase Missile destroyed itself at 101.5 seconds due to failure of flight-control system Pitch rate was about 1.55 times normal Just before breakup at 66,000 feet altitude missile had pitched over almost 90° due to higher than normal pitch rate producing excessive heating and aerodynamic loads At breakup flight path was nearly horizontal Impact was about 64 miles downrange 93 111D(Ranger-1 23 Aug 61 Response Mode NA Flight Phase The Agena achieved a normal parking orbit Flight continued normally until Agena second bum During the restart sequence the fuel valve failed to open so only oxygen was pumped into the thrust chamber Apogee of final orbit was only slightly above the normal circular parking-orbit altitude 9/10/96 120 RTI [PAGE 130] 94 26E Sep 61 Response Mode Flight Phase Sustainer engine shut down prematurely during the booster jettison sequence Most probable cause was drop in fuel flow to the gas generator The vernier engines continued to burn for about 28 seconds after the sustainer shut down Vernier thrust decayed at 137 seconds guidance platform tumbled at 163 seconds The missile remained intact until at least 470 seconds when data were lost Impact was about 525 miles downrange 95 106D LV-3A Agena First Motion Sep 61 Response Mode Flight Phase Failure of an umbilical to eject allowed a commit/stop-power signal to reach the missile Lack of electrical power 0.265 seconds after liftoff caused the vehicle to fall back on the launch pad after a rise of about 18 inches 99 105D LV-3A Agena Big Town Midas IV 21 Oct 61 Response Mode NA Flight Phase Flight was regarded as a success since the Agena compensated for Atlas anomalies Atlas roll control was lost at 186 seconds resulting in a roll rate of over 40° per second at Agena separation Control in pitch and yaw was maintained A LOX leak affected sustiliner performance just before SECO and throughout the vernier phase 100 32E 10 Nov 61 Response Mode Flight Phase Sustainer engine shut down 0.7 seconds after liftoff Although a fire appeared in the thrust section at 19 seconds booster engines maintained stability until 24.5 seconds when the engine-performance began to decay All control was lost after this point and the missile was destroyed by the RSO at 35 seconds Impact was about 2500 feet downrange and 320 feet crossrange 101 1170 Ranger-2),18 Nov 61 Response Mode NA Flight Phase The Atlas booster functioned normally A parking orbit was attained during the Agena first burn although roll control was not maintained due to failure of the roll gyro When control gas was depleted missile lost stability and began to tumble Second Agena bum lasted only one second 103 108D LV-3A)/Agena Round Trip 22 Nov 61 Response Mode Flight Phase Flight was not successful since vehicle failed to achieve orbit Loss of pitch control at 244 seconds was attributed to aerodynamic heating At Agena separation the Atlas had pitched up 145° 108 SF,12 Dec 61 Response Mode Flight Phase A failure in the inertial guidance system of 1.06 seconds duration caused the existing inertial velocity to be inserted in the Z-velocity channel As a result the missile impacted 575 miles short and 30 miles left of target 110 20 Dec 61 Response Mode Flight Phase Flight appeared normal until staging During booster jettison sustainer and vernier hydraulic pressure began to decay leading to compete loss of sustainer yaw and pitch control at 229 and 232 seconds respectively Missile began tumbling at about 226 seconds 9/10/96 121 RTI [PAGE 131] Sustainer engine shut down at 282 seconds Missile impacted 1300 miles downrange and 18 miles crossrange 111 114D LV-3A)/Agena Ocean Way 22 Dec 61 Response Mode NA Flight Phase Flight was considered successful although a failure in the flight programmer prevented the SECO signal from cutting off the sustainer engine Sustainer burned an additional 2.5 seconds to propellant depletion producing excess Atlas velocity 114 121 Ranger 26 Jan 62 Response Mode NA Flight Phase and Failure of pulse beacon in guidance system at 49 seconds caused sustainer to burn to LOX depletion resulting in a 300 ft sec overspeed Due to malfunction of pulse beacon at 49 seconds no guidance steering commands or discretes were given Booster was cut off by backup signal from accelerometer sustainer by fuel depletion Due to excess speed spacecraft passed 22,000 miles in front of moon and primary mission objective was not met All other Atlas and Agena systems performed as planned 116 1370 Big John 16 Feb 62 Response Mode NA Flight Phase 1.5 Flight was considered successful although RV did not separate properly 118 52D Chain Smoke 21 Feb 62 Response Mode Flight Phase A fire in the engine comparhnent resulted in shutdown of all engines at 60 seconds and vehicle explosion at 72 seconds 119 66E Silver Spur 28 Feb 62 Response Mode Flight Phase 1.5 and Loss of helium-bottle pressure resulted in failure to jettison booster engines and premature vernier-engine cutoff at 131.5 seconds Cutoff of verniers resulted in loss of roll control Vehicle exploded at 295 seconds 122 llF Apr 62 Response Mode Flight Phase An explosion in thrust section at 0.9 seconds after about feet of motion was followed by-a further explosion in the propellant tanks and total missile destruction at 1.2 seconds 123 110D LV-3A Agena Night Hunt Midas Apr 62 Response Mode NA Flight Phase An autopilot malfunction prevented sufficient pitchover during booster and sustainer phase resulting in improper SECO conditions and an improper orbit 128 104D May 62 Response Mode Flight Phase Flight appeared normal until about 45 seconds when weather shield shifted Further shocks occurred at 50 seconds with loss of weather shield Booster-engine cutoff was initiated at 55 seconds Missile destroyed itself at 57 seconds due to breakup of Centaur upper stage Recorded impact was 8500 feet downrange and 8200 feet crossrange 9/10/96 122 RTI [PAGE 132] 131 LV-3A Agena Rubber Gun 17 June 62 Response Mode Flight Phase Although Atlas performance was satisfactory the mission was apparently a failure No other data available 134 67E Extra Bonus 13 July 62 Response Mode Flight Phase and 2.5 A LOX leak in the high-pressure line apparently froze sustainer control components Residual sustainer thrust after cutoff continued for some 30 seconds causing a 120-mile overshoot 137 145D Mariner 22 July 62 Response Mode Flight Phase Booster stage and flight appeared normal until after booster staging at guidance enable at about 157 seconds Operation of guidance rate beacon was intermittent Due to this and faulty guidance equations erroneous guidance commands were given based on invalid rate data Vehicle deviations became evident at 172 seconds and continued throughout flight with a maximum yaw deviation of 60° and pitch deviation of 28° occurring at 270 seconds The vehicle deviated grossly from the planned trajectory in azimuth and velocity and executed abnormal maneuvers in pitch and yaw The missile was destroyed by the RSO at 293.5 seconds some 12 seconds after SECO 141 87D Peg Board II Aug 62 Response Mode Flight Phase 2.5 Failure of the sustainer/vernier hydraulic system to maintain system pressure prevented normal operation during the vernier solo phase 142 57F Crash Truck 10 Aug 62 Response Mode Flight Phase The roll program failed The missile was destroyed by the RSO at 68 seconds 144 179D Mariner 27 Aug 62 Response Mode NA Flight Phase Flight was successful although roll control was lost during the period from 140 seconds to 190 seconds due to erratic performance of vernier engine Before and after this time interval vernier and all other Atlas and Agena systems performed normally 146 Briar Street Oct 62 Response Mode Flight Phase The missile self- destructed at 183 seconds The vernier engines shut down prematurely at 46 seconds Subsequently closure of the vernier bleed valves led to excessively high sustainer performance and premature shutdown at 181.3 seconds 148 215 Ranger-5 18 Oct 62 Response Mode NA Flight Phase Flight was regarded as successful although failure in the ground control system 35 minutes after launch prevented accomplishment of primary lunar impact and study m1ss10n The guidance rate beacon failed at 94.6 seconds but backup differentiated tracking data kept the vehicle within normal limits 153 13F Action Time 14 Nov 62 Response Mode Flight Phase The flight was terminated when sustainer and vernier engines shut down prematurely at 9/10/96 123 RTI [PAGE 133] 94.3 seconds A thrust-section fire before 20 seconds apparently failed the lube oil system which led to cessation of propellant flow 156 131D LV-3A Agena Bargain Counter 17 Dec 62 Response Mode Flight Phase Mission failed because of an Atlas hydraulic failure Missile lost stability at 77.5 seconds then rolled clockwise pitched down and yawed left before breaking up at about 80.5 seconds 157 64E Oak Tree 18 Dec 62 Response Mode Flight Phase The engine failed at 37.1 seconds as a result of lubrication loss to the pinion gear Booster engine shutdown resulted in a violent rolling yaw maneuver that caused missile breakup followed by an explosion at about 38 seconds 158 160D Fly High 22 Dec 62 Response Mode Flight Phase Due to noisy data range safety limits in the automatic cutoff system were exceeded causing generation of an all-engines-cutoff signal As a result the vernier engines were cut off about 10 seconds early and the reentry vehicle was about 12.3 miles short 159 39D Big Sue 25 Jan 63 Response Mode Flight Phase Propulsion system performance was unsatisfactory after 78 seconds when booster engine performance started to decay Booster engines shut down shortly after this probably as a result of excessive heating in the gas-generator regulator The sustainer operated normally until at least 106 seconds with shutdown occurring sometime between 106 and 126 seconds Breakup occurred about 300 seconds Missile apparently impacted about 100 miles downrange 164 102D Tall Tree Mar 63 Response Mode Flight Phase A flight-control malfunction occurred at about 15 seconds at the start of the pitch program The missile pitched excessively reaching 310° and an altitude of 5,000 feet at 33.5 seconds when it broke up Debris impacted close to pad 166 64D Tall Tree 15 Mar 63 Response Mode Flight Phase A sustainer hydraulic-system failure at 83.5 seconds resulted in loss of sustainer engine control by 86 seconds and loss of vernier control at 99 seconds Missile control was maintained by the booster engines until booster cutoff when lack of sustainer and vernier control caused the missile to roll clockwise pitch up and yaw left Sustainer thrust decayed at 131 seconds and the missile began tumbling at 136.6 seconds Missile self-destructed at 146 seconds with impact point about 600 miles downrange 168 193D Leading Edge 16 Mar 63 Response Mode Flight Phase Loss of pitch feedback signal at 103.5 seconds resulted in loss of vehicle stability Missile tumbled then self-destructed at about 270 seconds 169 83F Kendall Green 21 Mar 63 Response Mode Flight Phase 2.5 A defective solder joint apparently led to two instances of erroneous velocity computations in 9/10/96 124 RTI [PAGE 134] the and velocity channels As a result the missile impacted about 12 miles short and 0.2 miles right of target 170 52F Tall Tree 23 Mar 63 Response Mode Flight Phase Missile self- destructed at about 91 seconds for unknown reasons Impact was near the flight line about 120 miles downrange 171 65E Black Buck 24 Apr 63 Response Mode NA Flight Phase 2.5 Vernier hydraulic-system pressure was lost at 301 seconds resulting in loss of vernier- engine control during the vernier solo phase The reentry vehicle impact point was not perceptibly affected by this malfunction 176 139D LV-3A Agena Big Four 12 Jun 63 Response Mode Flight Phase Flight appeared normal until about 88.4 seconds when due to a hydraulic failure the vehicle made a violent right and down maneuver The missile broke up five seconds later at 93.4 seconds 181 24E Silver Doll 26 July 63 Response Mode Flight Phase Spurious voltage transients caused premature pressurization of the vernier solo tanks at 101.3 seconds and premature sustainer engine shut down just after booster separation at 141 seconds 187 63D Cool Water III Sep 63 Response Mode Flight Phase All systems performed satisfactorily till 110 seconds when the sustainer/vernier hydraulic pressure dropped from 3080 to 490 psig The failure resulted in premature shutdown of the sustainer engine at 136 seconds Booster-engine cutoff occurred normally at 140.3 seconds and the booster was successfully jettisoned The impact point occurred about 620 miles downrange 188 84D Cool Water IV 11 Sep 63 Response Mode Flight Phase 2~5 Flight seemed normal through SECO although the pneumatic precharge to the vernier solo accumulator was lost at 96.6 seconds Due to this failure missile stability was lost near the start of the vernier solo phase The R/V probably failed to separate 189 71E Filter Tip 25 Sep 63 Response Mode Flight Phase Visual observers reported a boat-tail fire radical oscillations in yaw and rough running booster and sustainer engines Failure of the sustainer hydraulic system during the staging sequence resulted in loss of missile stability at 140 seconds Sustainer and vernier engines shut down at about 267 seconds with the impact point about 600 miles downrange 190 45F Hot Rum Oct 63 Response Mode Flight Phase The booster-engine fuel valve failed to open during the start sequence so the engine did not ignite Missile toppled over and exploded 9/10/96 125 RTI [PAGE 135] 191 163D Cool Water Oct 63 Response Mode Flight Phase Flight was normal up to about 73 seconds when the missile exploded Suspected cause was intermediate bulkhead reversal/rupture due to insufficient helium pressure 194 136F ABRES 28 Oct 63 Response Mode Flight Phase After a normal booster phase and staging failure of sustainer hydraulic system resulted in loss of sustainer control and stability at 138 seconds Sustainer and vernier engines shut down at 260 seconds some 28 seconds early The R/V impacted about 507 miles downrange 196 158D Cool Water VI 13 Nov 63 Response Mode Flight Phase The trajectory was low throughout flight The sustainer/vernier hydraulic pressure was lost at 112.7 seconds followed by missile self-destruct at about 118 seconds when the vacuum impact point was about 280 miles downrange and on azimuth 202 48E Blue Bay 12 Feb 64 Response Mode Flight Phase The booster engine shut down at 119.5 seconds and the sustainer engine shut down prematurely at 198.8 seconds Impact was near the flight line about 635 miles downrange 207 High Ball Apr 64 Response Mode Flight Phase Missile was destroyed on the pad when the Bl booster engine failed to ignite 212 135D AC-3 30 June 64 Response Mode Flight Phase The Centaur engines shut down early apparently due to a hydraulic coupling failure that led to a failure in the propellant system Impact was about 2340 miles downrange 219 57E Gallant Gal 27 Aug 64 Response Mode Flight Phase Missile experienced an early SECO with no vernier bum thereafter due to a guidance- system malfunction Impact was about 88 miles short and 0.4 miles right of target 227 289D Mariner-3),5 Nov 64 Response Mode Flight Phase A short second burn of the Agena prevented attainment of the desired orbit and resulted in a heliocentric orbit 232 146D 11 Dec 64 Response Mode NA Flight Phase Flight was completely normal through Centaur first bum During the coast phase liquid hydrogen vented through the vent valve caused vehicle instability and tumbling By second engine firing insufficient liquid hydrogen remained at boost-pump sump to sustain normal combustion 236 172D ABRES Beaver's Dam 21 Jan 65 Response Mode Flight Phase and The Atlas apparently performed normally except that the sustainer shut down 1.35 seconds early The OVl"l failed to·separate from the Atlas and thus failed to put the spacecraft in orbit 9/10/96 126 RTI [PAGE 136] 240 156D Mar 65 Response Mode Flight Phase At 0.36 seconds booster fuel- pump pressure dropped due to a fuel prevalve failure booster lost thrust fell back on launch pad and was destroyed at 3.26 seconds 251 68D ABRES Tennis Match 27 May 65 Response Mode Flight Phase A failure in the booster gas-generator loop resulted in decreasing booster performance after 116 seconds The impact point stopped moving at 122 seconds when an explosion occurred in the thrust section Further vehicle breakup occurred at 218 seconds Destruct was sent at 293 seconds Debris impacted close to the intended ground track 257 SLV-3/Agena White Pine 12 Jul 65 Response Mode Flight Phase Flight was normal until booster engines cutoff at 131 seconds As a result of a circuit board failure caused by excessive vibrations the sustainer also shutdown at BECO The Atlas booster engines did not separate immediately from the sustainer but did so some 50 seconds later after the event timer recycled The Agena subsequently separated and ignited at about 198 seconds creating wild uprange movements on the IP display by 255 seconds Destruct was sent at 257 seconds 267 SLV-3 GTV-6 25 Oct 65 Response Mode Flight Phase The flight was a failure although all Atlas objectives were achieved The Agena startup appeared normal but the engine shut down after about one second of operation Propellants ceased flowing but the helium pressurization system continued to pressurize the propellant tanks until they burst 276 303D Eternal Camp Mar 66 Response Mode Flight Phase Although track and rate lock were lost at 88 seconds missile appeared normal till about 112 seconds when skyscreen operator reported that vehicle was spiraling A hydraulic system failure occurred during the staging sequence resulting in loss of vehicle stability at 153 seconds and sustainer engine shutdown at 194 seconds The impact point initially appeared to stop about 800 miles downrange well beyond the booster impact point At about this time or shortly thereafter telemetry indicated rapidly varying pitch roll and yaw rates and shutdown of sustainer and vernier engines Final impact was estimated to be 976 miles downrange and left of the nominal track 279 304D White Bear 19 Mar 66 Response Mode Flight Phase The reentry vehicle impacted 82 miles beyond the target point when the head suppression valve failed to close at SECO The LOX tank thus vented through the sustainer chamber adding impulse in the process 281 184D AC-8 Apr 66 Response Mode Flight Phase Flight appeared normal until second Centaur burn Both Centaur engines started but one could not 9/10/96 127 RTI [PAGE 137] maintain thrust 1hrust imbalance resulted in tumbling followed by fuel starvation and early thrust termination 284 208D Crab Claw May 66 Response Mode Flight Phase High engine- compartment temperatures were first noted at 41 seconds The sustainer pitch- actuator feedback-loop failed open at 136 seconds a few seconds before planned BECO The flight appeared normal to the safety officer until about this time when roll and pitch rates increased The IIP apparently stopped about 155 seconds although General Dynamics reported that vehicle stability was not lost until 216 seconds Shutdown of sustainer and vernier engines occurred at 235 seconds Suspected cause of malfunction was excessive heating in·the boat-tail section 287 SLV-3 GTA-9 17 May 66 Response Mode Flight Phase Vehicle became unstable when pitch control was lost at 121 seconds Loss of pitch control resulted in a pitch-down maneuver much greater than 90° Guidance control was lost at 132 seconds After BECO the vehicle stabilized in an abnormal attitude Although the vehicle did not follow the planned trajectory SECO at 280 seconds VECO at 298 seconds and Agena separation occurred normally from programmer commands 294 96D Veneer Panel 10 Jun 66 Response Mode Flight Phase 2.5 The reentry vehicle undershot the target by 20 miles when the vernier engines shut down early Failure was caused by an abnormal decay of control-bottle helium pressure 298 58D ABRES Stony Island 13 July 66 Response Mode NA Flight Phase Flight was regarded as a success although one of two OV's failed to orbit when it impacted the structure door which had not been opened 300 149F Busy Ramrod Aug 66 Response Mode Flight Phase The sustainer engine shut down 27 seconds early due to fuel depletion caused by an unfavorable ratio of propellant usage during the booster stage Verniers burned to fuel depletion 306 194D AC-7 20 Sep 66 Response Mode NA Flight Phase Atlas Centaur performance was normal but Surveyor spacecraft lost stability on the way to the moon 308 115F Low Hill 11 Oct 66 Response Mode Flight Phase The missile was normal till about 85 seconds when it appeared to lose thrust and breakup Several major pieces impacted 32 to 40 miles downrange near the intended flight line 310 174D AC-9 26 Oct 66 Response Mode NA Flight Phase Although Atlas pressurization system anomaly caused decaying sustainer engine performance and early SECO no mission objectives were compromised 9/10/96 128 [PAGE 138] 318 148F Busy Stepson 17 Jan 67 Response Mode NA Flight Phase 2.5 Flight was norm.al except that reentry vehicle failed to separate 344 81F ABRES AFSC 27 Oct 67 Response Mode Flight Phase Although various anomalous events occurred early in flight the missile appeared to follow the intended trajectory till about 24 seconds Diverging roll oscillations actually began about 21.4 seconds and pitch and roll stability were lost by 24.8 seconds By 27.9 seconds the vehicle was tumbling about 6.5 degrees per second in pitch and yaw and 12 degrees per second in roll By 30 seconds the vehicle lost all thrust and began to break up Fuel cutoff and destruct were sent at 35 and 39 seconds respectively 358 95F ABRES AFSC May 68 Response Mode Flight Phase Immediately after liftoff the telemetered roll and yaw rates indicated that the missile was erratic During the first 10 seconds of flight the missile yawed hard to the left It then began a hard yaw to the right crossed over the flight line and continued toward the right destruct line Shortly thereafter the missile apparently pitched up violently and the IIP began moving back toward the beach The missile was destructed at about 45 seconds when the altitude was about 14,000 feet and the downrange distance about miles Major pieces impacted less than a mile offshore indicating uprange movement of the impact point during the last part of thrusting flight 364 5104C AC-17 ATS-D 10 Aug 68 Response Mode NA Flight Phase A normal parking orbit was achieved but when Centaur restart was attempted thrust could not be maintained because of inoperative boost pumps Frozen line was the apparent root cause 365 7004 SLV-3/Burner II Agena AFSC 16 Aug 68 Response Mode Flight Phase Atlas performance was norm.al The vehicle failed to achieve orbit because th protective shroud surrounding the second stage failed to separate 368 56F ABRES AFSC 16 Nov 68 Response Mode Flight Phase 2.5 Flight was norm.al through SECO The missile then lost attitude control executing a hard yaw rate tum throughout and beyond the vernier solo phase 372 5403C AC-20 Mariner Mars 24 Feb 69 Response Mode NA Flight Phase Early Atlas BECO due to staging accelerometer failure was compensated for by extended Atlas sustainer and Centaur burns Mission was successful 379 98F ABRES AFSC 10 Oct 69 Response Mode Flight Phase The missile appeared normal until about 66 seconds when the sustainer engine shut down prematurely The booster engine apparently continued normally to BECO At about 255 seconds the payload SPDS engine ignited Destruct was sent at 272 seconds 9/10/96 129 RT [PAGE 139] 388 5003C AC-21 OAO-B 30 Nov 70 Response Mode Flight Phase Since the nose fairing failed to separate Centaur did not have enough energy to make orbit Payload impacted in Africa 392 5405C AC-24 Mariner Mars May 71 Response Mode Flight Phase Mission requirements were not met The Atlas boost phase was normal Shortly after Centaur main-engine start pitch stabilization was lost due to failure of the rate gyro or an electrical failure in the pitch channel of the flight control system The vehicle began an accelerated nose-down tumbling motion that subsequently resulted in early and erratic main-engine shutdown due to propellant starvation 397 SLV-3A Agena Dec 71 Response Mode Flight Phase Sustainer engine turbine damage during engine start resulted in hot gas leaks and eventual failure of thrust-section hardware Vehicle broke up at 87 seconds 419 5015D AC-33 Intelsat IV 20 Feb 75 Response Mode Flight Phase The Atlas booster-section electrical disconnect failed at booster staging The harness was pulled apart so flight-control avionics was unable to maintain vehicle stability Missile appeared normal until the IP stopped at 200 seconds Precautionary destruct was sent at 414 seconds 420 71F AFSC 12 Apr 75 Response Mode Flight Phase Although an abnormal overpressure occurred at the base of the missile 620 msec before liftoff the vehicle appeared normal until about 45 seconds when sustainer manifold and fuel-pump pressures began dropping By 61 seconds both the sustainer and vernier engines had shut down Booster engines continued thrusting until about 123 seconds when the IIP stopped moving and radar operator reported multiple pieces The breakup apparently resulted from an external explosion in the flame bucket that damaged the thrust section Destruct was sent at 303 seconds when missile elevation dropped to 432 5701D AC-43 Intelsat IV A 29 Sep 77 Response Mode Flight Phase A leak in the booster hot-gas generator at 2.3 seconds resulted in a fire in the thrust section at 36.5 seconds The vehicle went into a violent maneuver at 54.9 seconds failing the structure The Atlas exploded at 55.8 seconds leaving the Centaur intact The Centaur was destroyed by the RSO at 61.7 seconds 457 19F NOAA-B 29 May 80 Response Mode NA Flight Phase Failure of turbopump seal allowed fuel to enter the gear box resulting in 21 low thrust by the Bl booster engine The payload was inserted into- an abnormal orbit and the mission was lost 460 68E Dec 80 Response Mode Flight Phase Flight appeared normal until 102.7 seconds when the lube oil pressure on the booster engine suddenly dropped At 120.1 seconds the engine shut down followed 385 msec later by guidance shutdown of the Bl engine The asymmetric thrust during shutdown 9/10/96 130 RTI [PAGE 140] caused yaw and roll rates that the flight control system could not correct As a result attitude control was lost and the thrusting sustainer pivoted the missile to a retrofire attitude before the vehicle could be stabilized After the booster package was jettisoned the missile was stabilized and decelerating in the retrofire mode by 148 seconds The sustainer continued thrusting in this attitude until 282.9 seconds when reentry heating apparently caused sustainer shutdown and vehicle breakup 464 5039D AC-59 FLTSATCOM Aug 81 Response Mode NA Flight Phase and The basic mission was accomplished although three increasingly severe shock events were recorded at 56.2 70,7 and 120.8 seconds The structural damage sustained by the spacecraft severely limited on-orbit operations 466 76E NA VSTAR VII 18 Dec 81 Response Mode Flight Phase Shortly after clearing the launch tower at an altitude of about two tower heights the thrust performance of the Bl engine began to decay The engine was shut down completely by 7.4 seconds The unbalanced thrust caused the missile to pitch over to the right and travel horizontally for about one second It then pitched toward the ground A small explosion occurred about one-third of the way down followed by a larger explosion when the missile impacted the ground directly behind the launch pad about 19 seconds after liftoff Cause of the engine failure was plugging of the gas-generator fuel-cooling parts that resulted in a gas- generator bum-through 477 5042G AC-62 Intelsat Jun 84 Response Mode Flight Phase Performance was normal until an abnormal shock event occurred at Atlas/Centaur separation Subsequent data indicated that a Centaur oxygen tank leak resulted in a loss of 1483 pounds of LOX during Centaur first burn The leak resulted in the LOX tank pressure falling below the LH2 tank pressure which led to collapse of the intermediate bulkhead during the coast phase Bulkhead collapse caused unexpected tumbling forces during coast The Centaur engines restarted after coast but burned for only or secorids of a planned 90-second bum 489 5048G AC-67 FLTSATCOM 26 Mar 87 Response Mode Flight Phase Vehicle performance was normal till 48.4 seconds when the vehicle was struck by lightning As a result the guidance computer commanded a hard right tum which caused vehicle breakup due to inertial and aerodynamic loads RSO sent destruct at 70.7 seconds 498 5050 AC-70 BS-3H COMSAT 18 Apr 91 Response Mode Flight Phase Atlas performance was normal Although both Centaur main engines began the start sequence properly the turbo-machinery decelerated and stopped leaving the engine thrust at the ignition level Air entering through the stuck- open check valve liquefied and froze in the LH2 pump and gear box of the 9/10/96 131 RTI [PAGE 141] engine thus preventing the engine from achieving full thrust Due to the resulting thrust imbalance the vehicle tumbled out of control Destruct was sent some 80 seconds after Centaur ignition 506 5051 AC-71 Galaxy lR 22 Aug 92 Response Mode Flight Phase A Centaur engine check valve stuck open allowing air into the turbopumps Air entering through the stuck-open check valve liquefied and froze in the LH2 pump and gear box of the engine which prevented the engine from achieving full thrust Destruct was sent by the RSO about 193 seconds after Centaur ignition This is the same failure experienced by AC-70 launched on 18 Apr 91 507 5054 AC-74 UHF Follow On-1 25 Mar 93 Response Mode NA Flight Phase and The flight was considered successful although below normal Atlas performance resulted in a low spacecraft apogee 5000 nm vice planned 9225 nmk The perigee altitude was near nominal at 120 run A loose screw that allowed the oxygen regulator to go out of adjustment caused booster-engine thrust to drop to 65% of nominal at 103 seconds The booster engines remained attached to the sustainer which flew to propellant depletion These events led to depletion shutdown of the Centaur stage 22 seconds early 9/10/% 132 RTI [PAGE 142] Delta Launch and Performance History The Delta launch-vehicle family originated in 1959 with a NASA contract to Douglas Aircraft Company now McDonnell Douglas Corporation The Delta using components form USAF's Thor IRBM program and USN's Vanguard launch-vehicle program was operational 18 months later On May 13 1960 the first Delta was launched from Cape Canaveral with a 179-pound Echo-I passive communications satellite In the intervening years the Delta has evolved to meet the ever-increasing demands of its payloads including weather scientific and communications satellites Each Delta modification corresponded to an increase in payload capacity Table 42 shows a summary of Delta configurations since the beginning of the program 1101 The Delta 7925 the latest vehicle in the series is a three-stage liquid-propellant vehicle with nine solid-propellant strap-on booster motors For propellants the Delta uses RP and liquid oxygen in Stage and nitrogen tetroxide and aerozine 50 in Stage Stage consists of a Payload Assist Module PAM with a solid-propellant motor The strap-on boosters are Hercules graphite epoxy motors GEMs using HTPB-type solid propellant At liftoff the liquid-propellant Stage-1 engine and six of the nine GEMs are ignited The remaining three GEMs are ignited some 65 seconds later Table 42 Summary of Delta Vehicle Configurations Configuration Description Delta Stg Modified Thor MB-3 Blk I engine Stg Vanguard AJl0-118 propulsion system Stg Vanguard X-248 motor A Stg Erurine replaced with MB-3 Blk II Stg Tanks lengthened higher energy oxidizer used Stg Replaced with Scout X-258 motor PLF Bulbous replaced low drag Stg Added Thor-developed SRMs Castor I Stg Castor II replaced Castor I Stg MB-3 Blk III replaced Blk II Stg Propellant tank diameters increased Stg Replaced with USAF-developed FW-4 motor PLF Fairing enlarged to 65-inch diameter Stg TE-364-3 used L,M,N Stg Tanks lengthened RP-1 tank diameter increased Stg Varied FW-4 TE-364-3 none Stg Six Castor IIs employed 900 Stg No Castor Ils employed Stg Replaced with Transtage AJ10-118F engine 1604 Stg Six Castor IIs employed Stg Replaced with TE-364-4 9/10/96 133 RTI [PAGE 143] Configuration Description 1910 1913 Stg Nine Castor Ils employed 1914 Stg Varied none 1910 TE-364-3 1913 TE-364-4 1914 PLF 96-inch diameter replaced 65-inch 2310 2313 Stg Three Castor Ils employed 2314 Stg RS-27 replaced MB-3 Stg TR-201 engine replaced AJ10-118F Stg Varied none 2310 TE-364-3 2313 TE-364-4 2314 2910 2913 2914 3910 3913 3914 3920,3924 4920 5920 6925 Stg Nine Castor Ils employed Stg Varied none 2910 TE-364-3 2913 TE-364-4 2914 Stg Nine Castor replaced Castor Ils Stg Varied:none or PAM 3910),TE-364-3 3913),TE-364-4 3914 Stg AJ10-118K engine replaced TR-201 Stg Varied none or PAM 3920 TE-364-4 3924 Stg Castor NA replaced Castor Stg MB-3 replaced RS-27 Stg RS-27 replaced MB-3 Stg Tanks lengthened 12 feet Stg STAR 48B motor used PLF Bulbous 114-inch diameter used 7925 Stg GEM replaced Castor NA Stg RS:.27 A replaced RS-27 9/10/96 134 RTI [PAGE 144] The entire Delta history through 1995 is depicted rather compactly in bar-graph form in Figure 38 The solid-block portion of each bar indicates the number of launches during the calendar year for which vehicle performance was entirely normal in so far as could be determined The clear white parts forming the tops of most bars show the number of launches that were either failures or flights where the launch vehicle experienced some sort of anomalous behavior Every launch with an entry in the response-mode column in Table 43 falls in this category Such behavior did not necessarily prevent the attainment of some or even all mission objectives 16 14 en 12 en en 10 ti 55 60 65 70 75 80 85 90 95 Launch Year Figure 38 Delta Launch Summary 9/10/% 135 RT [PAGE 145] D.3.1 Delta Launch History The data in Table 43 summarizes all Delta and Delta-boosted space-vehicle launches since the program began A launch sequence number is provided in the first column A launch ID and date are provided in columns and The fourth column indicates the vehicle configuration The fifth column indicates the launch range The sixth column indicates the failure-response mode through and NA that RTI has determined best describes the failure that occurred For Mode or failures a suffix of indicates the vehicle tumbled Successful launches are indicated by a blank in the Response-Mode column The seventh column indicates the operational flight phase during which the failure occurred The last column indicates whether the vehicle configuration is representative of those being launched today Launches through sequence number 232 were used in the filtering process to estimate failure rate Table 43 Delta Launch History No Mission/ID ECHOI Launch Date 05/13/60 Vehicle Confiauration DM-19 Test Ranae ER Response Mode Flight Phase 2.5 Rep Cont ECHO IA TIROSA2 08/12/60 11/23/60 DM-19 DM-19 ER ER P-14 03/25/61 DM-19 ER TIROSA3 07/12/61 DM-19 ER 08/15/61 DM-19 ER 10 TIROS S-16 S-51 TIROS 02/08/62 03/07/62 04/26/62 06/19/62 DM-19 DM-19 DM-19 DM-19 ER ER ER ER NA 11 TSX-1 07/10/62 DM-19 ER 12 13 14 15 16 17 18 19 20 21 22 23 24 TIROS S-3A S-3B RELAY A-15 SYNCOMA-25 TSX-2 TIROSG SYNCOMA-26 IMPA TIROS RELAY A-16 S-66 09/18/62 10/02/62 10/27/62 12/13/62 02/13/63 04/02/63 05/07/63 06/19/63 07/26/63 11/26/63 12/21/63 01/21/64 03/19/64 DM-19 ER DSV-3A ER DSV-3A ER DSV-38 ER DSV-38 ER DSV-38 ER DSV-38 ER DSV-38 ER DSV-38 ER DSV-3C ER DSV-38 ER DSV-38 ER DSV-38 ER 25 26 27 SYNCOM A-27 IMP-B S-3C 08/19/64 10/03/64 12/21/64 DSV-3D DSV-3C DSV-3C ER ER ER NA 28 TIROSI 01/22/65 DSV-3C ER NA 2&5 29 OSO-B 02/03/65 DSV-3C ER 30 COMSAT#1 04/06/65 DSV-3D ER 9/10/96 136 RTI [PAGE 146] 31 32 33 34 35 36 37 38 39 40 41 42 43 44 45 46 47 48 49 50 51 52 53 54 55 56 57 58 59 60 61 62 63 64 65 66 67 68 69 70 71 72 73 74 75 76 No Mission/ID Launch Date Vehicle Confiauration Test Ranae Response Mode Flight Phase Rep Conf IMP-C 05/29/65 DSV-3C ER TIROSOT-1 07/01/65 DSV-3C ER OSO-C 08/25/65 DSV-3C ER 2.5 GEOSA PIONEER A TIROSOT-3 TIROSOT-2 11/06/65 12/16/65 02/03/66 02/28/66 DSV-3E DSV-3E DSV-3C DSV-3E ER ER ER ER NA 2&5 AE-8 AIMP-0 05/25/66 07/01/66 DSV-3C DSV-3E ER ER NA NA 2&5 2.5&5 PIONEER-8 08/17/66 DSV-3E ER TOS 10/02/66 DSV-3E WR lNTELSAT 11 BIOS-A INTELSAT II TOS 10/26/66 12/14/66 01/11/67 01/26/67 DSV-3E DSV-3G DSV-3E DSV-3E ER ER ER WR OSO-E1 03/08/67 DSV-3C ER INTELSAT II 03/22/67 DSV-3E ER TOSO 04/20/67 DSV-3E WR IMP-F 05/24/67 DSV-3E WR AIMP-E 8108-8 INTELSAT II 07/19/67 09/07/67 09/27/67 DSV-3E DSV-3G DSV-3E ER ER ER OS0-D 10/18/67 DSV-3C ER TOS-C PIONEER-C 11/10/67 12/13/67 DSV-3E DSV-3E WR ER GEOS-8 RAE-A TOS-E INTELSAT Ill-A PIONEER-0 01/11/68 07/04/68 08/16/68 09/18/68 11/08/68 DSV-3E DSV-3E DSV-3L DSV-3L DSV-3E WR WR WR ER ER HEOS-A 12/05/68 DSV-3E ER TOS-F INTELSAT 111-C O80-F ISIS-A INTELSAT 111-B TOS-G 12/15/68 12/18/68 01/22/69 01/30/69 02/05/69 02/26/69 DSV-3L DSV-3L DSV-3C DSV-3E DSV-3L DSV-3E WR ER ER WR ER ER INTELSAT 111-D 05/21/69 DSV-3L ER IMP-G BIOS-D INTELSAT 111-E OS0-G PIONEER-E IDCSP/A-A INTELSAT 111-F TIROs-M 06/21/69 06/29/69 07/26/69 08/09/69 08/27/69 11/22/69 01/14/70 01/23/70 DSV-3E DSV-3L DSV-3L DSV-3L DSV-3L DSV-3L DSV-3L DSV-3L WR ER ER ER ER ER ER WR 3&5 9/10/96 137 RTI [PAGE 147] Launch Vehicle Test Response Flight Rep No Mission/lo Date Confiauration Ranae Mode Phase Cont NATO-A 03/20/70 DSV-3L ER 78 INTELSAT 111-G 04/22/70 DSV-3L ER NA 1&5 79 INTELSAT 111-H 07/23/70 DSV-3L ER 80 IDCSP/A·B 08/19/70 DSV-3L ER 81 ITOS-A 12/11/70 DSV-3L WR 82 NAT0-8 02/03/71 DSV-3L ER 83 IMP-I 03/13/71 DSV-3L ER 84 ISIS-B 04/01/71 OSV-3E WR 85 OS0-H 09/29/71 DSV-3L ER NA 2&5 86 I TOS-8 10/21/71 DSV-3L WR 87 HEOS-A2 01/31/72 DSV-3L WR 88 TO-1 03/11/72 DSV-3L WR 89 EATS-A 07/23/72 900 WR 90 IMP-H 09/22/72 1604 ER 91 ITOS-O 10/15/72 300 WR 92 TELESAT-A 11/10/72 1914 ER 93 NIMBUS-E 12/10/72 900 WR 94 TELESAT-8 04/20/73 1914 ER 95 RAE-B 06/10/73 1913 ER 96 ITOS-E 07/16/73 300 WR 97 IMP-J 10/26/73 1604 ER 98 I TOS-F 11/06/73 300 WR 99 AE-C 12/16/73 1900 WR 100 SKYNETIIA 01/19/74 2313 ER NA 4&5 101 WESTAR-A 04/13/74 2914 ER NA 102 SMS-A 05/17/74 2914 ER NA 1&5 103 WESTAR-B 10/10/74 2914 ER 104 ITOs-G 11/15/74 2310 WR 105 SKYNET-11B 11/22/74 2313 ER 106 SYMPHONIE-A 12/18/74 2914 ER 107 ERTS-B 01/22/75 2910 WR 108 SMS-8 02/06/75 2914 ER 109 GEOS-C 04/09/75 1410 WR 110 TELESAT-C 05/07/75 2914 ER 111 NIMBUs-F 06/12/75 2910 WR 112 OS0-1 06/21/75 1910 ER 113 COS-B 08/08/75 2913 WR 114 SYMPHONIE~B 08/26/75 2914 ER 115 AE-D 10/06175 2910 WR 116 GOES-A 10/16/75 2914 ER 117 AE-E 11/19/75 2910 ER 118 RCA-SA TCOM-A 12/12/75 3914 ER 119 CTS 01/17/76 2914 ER 120 MARISAT-A 02/19/76 2914 ER 121 RCA-SATCOM-8 03/26/76 3914 ER 122 NATO-IIIA 04/22/76 2914 ER 9/10/96 138 RTI [PAGE 148] Launch Vehicle Test Response Flight Rep No Mission/ID Date Confiauration Ranae Mode Phase Cont 123 LAGEOS 05/04/76 2913 WR 124 MARISAT-B 06/10ll6 2914 ER 125 PALAPA-A 07/08ll6 2914 ER 126 ITOS-E2 07/29ll6 2310 WR 127 MARISAT-C 10/14ll6 2914 ER 128 NATOIIIB 01121n1 2914 ER 129 PALAPA-B 03/1om 2914 ER 130 ESRO-GEOS 0412.om 2914 ER NA 2.5&5 131 GOES-8 06116m 2914 ER 132 GMS 01I14m 2914 ER 133 SIRIO 08/25ll7 2313 ER 134 OTS 09/13m 3914 ER 135 ISEEA/8 10122m 2914 ER 136 METEOSAT-F1 11122m 2914 ER 137 cs 12114m 2914 ER 138 IUE 01/26/78 2914 ER 139 L&SAT-C 03/05/78 2910 WR 140 BSE 04/07ll8 2914 ER 141 OTS-2 05/11ll8 3914 ER 142 GOES-C 06/19ll8 2914 ER 143 ESRO-GEOS2 07/14ll8 2914 ER 144 ISEE-C 08/12n8 2914 ER 145 NIMBUs-G 10/24ll8 2910 WR 146 NATOIIIC 11/19ll8 2914 ER 147 TELESAT-D 12/16ll8 3914 ER 148 SCATHA 01/30/79 2914 ER 149 WESTAR-C 08/09ll9 2914 ER 150 RCA-C 12/07ll9 3914 ER 151 SMM 02/14/80 3910 ER 152 GOES-O 09/09/80 3914 ER 153 SBS-A 11/15/80 3910 PAM ER 154 GOES-E 05/22/81 3914 ER 155 DE 08/03/81 3913 WR NA 2&5 156 SBS-B 09/24/81 3910 PAM ER 157 SME 10/06/81 2310 WR 158 RCA-0 11/20/81 3910 PAM ER 159 RCA-C 01/15/82 3910PAM ER 160 WESTAR-IV 02/26/82 3910 PAM ER 161 INSAT-IA 04/10/82 3910 PAM ER 162 WESTAR-V 06/09/82 3910 PAM ER NA 163 L&SAT-D 07/16/82 3920 WR 164 TELESAT-F 08/26/82 3920PAM ER 165 RCA-E 10/27/82 3924 ER 166 IRAS 01/26/83 3910 WR 167 RCA-F 04/11/83 3924 ER 168 GOES-F 04/28/83 3914 ER 9/10/96 139 RTI [PAGE 149] Launch Vehicle Test Response Flight Rep No Mission/ID Date Confiauration Range Mode Phase Conf 169 EXOSAT 05/26/83 3914 WR 170 GALAXY-A 06/28/83 3920 PAM ER 171 TELSTAR-3A 07/28/83 3920 PAM ER 172 RCA-G 09/08/83 3924 ER 173 GALAXY-B 09/22/83 3920 PAM ER 174 L&SAT-D 03/01/84 3920 WR 175 AMPTE 08/16/84 3924 ER 176 GALAXY-C 09/21/84 3920 PAM ER 177 NATO-IIID 11/14/84 3914 ER 178 GOES-G 05/03/86 3914 ER 179 DELTA 180 09/05/86 3920 ER 180 GOES-H 02/26/87 3924 ER 181 PALAPA B2-P 03/20/87 3920 PAM ER 182 DELTA 181 02/08/88 3910 ER 183 NAVSTAR 11-1 02/14/89 6925 ER 184 DELTA STAR 03/24/89 3920 ER 185 NAVSTAR 11-2 06/10/89 6925 ER 186 NAVSTAR 11-3 08/18/89 6925 ER 187 BSB-R1 08/27/89 4925 ER 188 NAVSTAR 11-4 10/21/89 6925 ER 189 OOBE 11/18/89 5920 WR 190 NAVSTAR 11-5 12/11/89 6925 ER 191 NAVSTAR 11-6 01/24/90 6925 ER 192 LOSAT 02/14/90 6920-8 ER 193 NAVSTAR 11-7 03/26/90 6925 ER 194 PALAPA B-2R 04/13/90 6925 ER 195 ROSAT 06/01/90 6920-10 ER 196 INSAT-1D 06/11/90 4925 ER 197 NAVSTAR 11-8 08/02/90 6925 ER 198 BSB-R2 08/18/90 6925 ER 199 NAVSTAR 11-9 10/01/90 6925 ER 200 INMARSAT-2F1 10/30/90 6925 ER 201 NAVSTAR 11-10 11/26/90 7925 ER 202 NATO IVA 01/07/91 7925 ER 203 INMARSAT-2F2 03/08/91 6925 ER 204 ASC-2 04/12/91 7925 ER 205 AURORA II 05/29/91 7925 ER 206 NAVSTAR 11-11 07/03/91 7925 ER 207 NAVSTAR 11-12 02/23/92 7925 ER 208 NAVSTAR 11-13 04/09/92 7925 ER 209 PALAPA 84 05/13/92 7925-8 ER 210 EUVE 06/07/92 6920-10 ER 211 NAVSTAR 11-14 07/07/92 7925 ER 212 GEOTAIL 07/24/92 6925 ER 213 SATCOM 08/31/92 7925 ER 214 NAVSTAR 11-15 09/09/92 7925 ER 9/10/96 140 RTI [PAGE 150] launch Vehicle Test Response Flight Rep No Mission/ID Date Confiauration Ranae Mode Phase Cont 215 COPERNIKUS 10/12/92 7925 ER 216 NAVSTAR 11-16 11/22/92 7925 ER 217 NAVSTAR 11-17 12/18/92 7925 ER 218 NAVSTAR 11-18 02/03/93 7925 ER 219 NAVSTAR 11-19 03/30/93 7925 ER 220 NAVSTAR 11-20 05/13/93 7925 ER 221 NAVSTAR 11-21 06/26/93 7925 ER 222 NAVSTAR 11·22 08/30/93 7925 ER 223 NAVSTAR 11-23 10/26/93 7925 ER 224 NATOIVB 12/08/93 7925 ER 225 GALAXYI-R 02/19/94 7925-8 ER 226 NAVSTAR 11-24 03/10/94 7925 ER 227 WIND 11/01/94 7925-10 ER 228 KOREASAT 08/05/95 7925 ER NA 1&5 229 RADAR SAT 11/04/95 7920-10 ER 230 X-RAY EXPLORER 12/30/95 7920A-10 ER 231 KOREASAT-2 01/14/96 7925 ER 232 NEAR 02/17/96 7925-8 ER 233 POLAR 02/24/96 7925-10 WR 234 GPS-7 03/27/96 7925-8 ER 235 MSX 04/24/96 7920-10 WR 236 GALAXY1X 05/24/96 7925A ER 237 GP8-26 07/16/96 7925-9.5 ER 9/10/% 141 RTI [PAGE 151] D.3.2 Delta Failure Narratives The following narratives provide available details about each Delta failure since the beginning of the Delta program The narratives are numbered to match the flight- sequence numbers in Section D.3.1 Echo I 13 May 60 Response Mode Flight Phase 2.5 Attitude control lost during second stage coast period Third stage spun up but did not fire 10 Tiros 19 June 62 Response Mode NA Flight Phase The flight was considered a success although failure of the BTL guidance system resulted in a propellant- depletion shutdown of the second stage The apogee of the final orbit was 175 miles above the planned value and well outside the three-sigma limit of 76 miles 24 S-66 19 Mar 64 Response Mode Flight Phase Spacecraft did not attain orbit Third-stage bum of X-248 motor was interrupted after 23 seconds of a planned 42- second bum period 26 Imp Oct 64 Response Mode NA Flight Phase The flight was considered a partial success although it failed to reach the desired orbital altitude The apogee was some 52,590 miles below the planned value of 110,000 miles but perigee was within miles of the desired value of 105 miles 28 Tiros I 22 Jan 65 Response Mode NA Flight Phase and Loss of WECO guidance during second-stage burn caused second stage to burn to oxygen depletion As a result spacecraft was inserted into an elliptical rather than a circular orbit 33 O50-C 25 Aug 65 Response Mode Flight Phase 2.5 Third stage ignited after spin up but before separation from second-stage spin table Payload did not orbit 34 GEOS A Nov 65 Response Mode NA Flight Phase and The flight was considered a success although failure of the BTL guidance system during second- stage powered flight led to a propellant-depletion shutdown of the stage Actual apogee was 436 miles too high and well outside the three-sigma limit 38 AF-ff 25 May 66 Response Mode NA Flight Phase and Due to- WECO guidance failure ground system·Iocked on side lobe second stage burned to propellant depletion some 12 seconds longer than expected As a result the orbital apogee was 800 miles higher than planned 39 AIMP-D July 66 Response Mode NA Flight Phase 2.5 and Although an alternate mission was accomplished primary objectives could not be achieved because excess velocity imparted to the spacecraft prevented insertion of the 9/10/96 142 RTI [PAGE 152] spacecraft into a lunar orbit Possible cause was malfunction of the coast-control system after third-stage spinup and separation 59 Intelsat III A 18 Sep 68 Response Mode Flight Phase Due to loss of rate gyro undamped pitch oscillations began at 20 seconds Vehicle began a series of violent maneuvers at 59 seconds During the 13-second period while these maneuvers continued the vehicle pitched down some 270° then up 210° and then made a large yaw to the left At 72 seconds the vehicle regained control and flew stably in a down and leftward direction until 100 seconds At this time with the main engine against the pitch and yaw stops the destabilizing aerodynamic forces became so large that quasi-control could no longer be maintained The first stage broke up at 103 seconds The second stage was destroyed by the RSO at 110.6 seconds Major pieces impacted about 12 miles downrange and miles left of the flight line 71 Intelsat III 26 July 69 Response Mode NA Flight Phase and Unknown but anomalous third-stage performance inserted payload into an erroneous orbit Apogee was some 17,000 miles too low and orbital inclination was 1.5° above planned 28.8° 73 Pioneer 27.Aug 69 Response Mode Flight Phase First-stage hydraulics system failed a few seconds before burnout MECO The vehicle pitched down yawed left rolled counterclockwise driving all gyros off limits and then tumbled Second-stage separation and ignition occurred while the vehicle was out of control After about 20 seconds the second stage regained control in a yaw-right pitch-up attitude The vehicle flew stably in this attitude for about 240 seconds until destroyed by the safety officer at +484 seconds 78 Intelsat III 22 Apr 70 Response Mode NA Flight Phase and The flight was considered a success although low first-stage velocity resulted in a propellant- depletion shutdown of the second stage As a result the actual apogee was some 2,220 miles below the planned value of 195,400 miles and well outside three- sigma limits 85 0S0-H 29 Sep 71 Response Mode NA Flight Phase and Stage-2 hydraulic- system failure caused faulty control during second-stage bum Spacecraft injected initially into an elliptical orbit but was later maneuvered into a more satisfactory orbit although perigee was still about 93 miles below the planned value 86 ITOS-B WTR 21 Oct 71 Response Mode Flight Phase Contamination in the oxygen vent valve apparently prevented its proper operation throughout flight This led to bulkhead rupture during second-stage bum and loss of vehicle control 9/10/96 143 [PAGE 153] 96 ITOS:-E WTR 16 July 73 Response Mode Flight Phase Pump-motor failure during second-stage bum at 490 seconds resulted in loss of hydraulic pressure loss of attitude control and vehicle tumbling 100 Skynet IIA 19 Jan 74 Response Mode NA Flight Phase and Flight was within normal limits until impact point passed through Africa gate During the second bum of the second stage a short circuit in the second-stage electronics package resulted in an improper spacecraft orbit The satellite reentered the earth's atmosphere five days later on 24 Jan 74 101 WESTAR-B 13 Apr 74 Response Mode NA Flight Phase One solid-rocket motor carried to MECO but mission was still a complete success 102 SMS-A 17 May 74 Response Mode NA Flight Phase and Mission was a partial success although low first-stage velocity resulted from a liquid oxygen pressure line failure and a booster shroud that snagged before fully jettisoning Apogee was some 1,767 miles below the planned value and well outside three- sigma limits 130 ESRO-GOES 20 Apr 77 Response Mode NA Flight Phase 2.5 and Due possibly to a short circuit in the second stage or failure in one of the two explosive bolts that hold the stage 2/3 clamp band together the third stage separated prematurely from the second stage while spinning at only two rpms instead of the normal 97 rpms As a result coning during third-stage bum resulted in a spacecraft apogee nearly 13,000 miles low and far outside three-sigma limits 134 OTS 13 Sep 77 Response Mode Flight Phase Core vehicle exploded at 57 seconds due to a burn through on the forward end of the Castor IV motor 155 DJr Aug 81 Response Mode NA Flight Phase and Flight was considered a success although a 260-pound deficiency in fuel loading led to a premature propellant-depletion shutdown of the second bum of the second stage and degradation of final orbit The inertial velocity at SECO was 240 ft sec lower than planned Final apogee was some 855 miles too low and well outside three-sigma limits 162 WESTAR-V June 82 Response Mode NA Flight Phase Booster performance was low but mission was a success Apogee and perigee were within three-sigma limits 178 GOES-G May 86 Response Mode Flight Phase An electrical short in a control circuit in first-stage relay box caused premature main-engine shutdown at 71 seconds Vehicle then tumbled and was broken up by aerodynamic forces RSO sent destruct at approximately 91 seconds 9/10/96 144 RTI [PAGE 154] 228 Koreasat Aug 95 Response Mode NA Flight Phase and One of three air- ignited strap-on GEMs did not separate because of a malfunction in the separation explosive transfer system Failure to drop a GEM motor resulted in depletion of second-stage propellants Although perigee was close to nominal the apogee was 3,450 nm below the planned value and far outside the 3-sigma limits 9/10/96 145 RTI [PAGE 155] Titan Launch and Performance History The Titan family of launch vehicles was established in 1955 when the Air Force awarded the Martin Company a contract to build a heavy-duty space system Titan I was the nation's first two-stage ICBM and the first to be silo-based It proved many structural and propulsion techniques that were later incorporated into Titan II The Titan II was a heavy-duty missile using storable propellants that became a man-rated space booster for NASA's Gemini program Today the Titan II is returning as a space- launch vehicle with the old ICBMs converted to deliver payloads to orbit Titan III was the outgrowth of propulsion technology developed in both Titan II and Minuteman ballistic-missile programs Today's Titan vehicles II III and IV are derived from the earlier Titans In 1984 the DOD called for a space-launch system that would complement the Space Shuttle to ensure access to space for certain national-security payloads The Titan IV program began as a short-term program for ten launches from Cape Canaveral Air Station However after the Challenger accident in 1986 the program has grown to 41 vehicles With the off-loading of DOD payloads from Shuttle Titan IV has become DOD's main access to space for many of its heavy payloads Design of the Titan II Space Launch Vehicle SLV began at the same time as that for Titan IV Titan II SLV was developed from refurbished Titan II ICBMs incorporating technology and hardware from the Titan III program 9/10/96 146 RTI [PAGE 156] Shortly after the Challenger accident in 1986 when the US government decided to offload commercial payloads from the Space Shuttle Martin Marietta announced plans to develop a Titan III commercial launch vehicle with its own funds The commercial Titan III is derived from the Titan 34D with a stretched second stage and a bulbous shroud for dual or dedicated payloads The first commercial Titan III was launched with two communications satellites in December 1989 Table 44 shows a summary of Titan space-vehicle configurations since Gemini 1101 Confi ation II Gemini IIIB 34B IIIC HID IIIE 34D IISLV III Commercial IV 9/10/96 Table 44 Summa of Titan Vehicle Confi rations Descri Titan II ICBM converted to a man-rated vehicle Same as Titan II Gemini except stretched stages and and an inte al Trans Same as IIIA Same as IIIC ex Same as 34B with added 5½-segment SRMs Uses either Transtage orIUSu Refurbished II ICBM with 10-foot diameter PLF Same as 34D except stretched stage single or dual carrier enhanced liquid-rocket engines and 13.1-foot diameter PLF Can use PAM-D2 Transta or TOS er sta Same as 34D except stretched stages and 7-segment SRM or segment SRMU and 16.7-foot diameter PLF Can use IUS or Centaur er sta 147 RTI [PAGE 157] The entire Titan history through 1995 is depicted rather compactly in bar-graph form in Figure 39 The solid-block portion of each bar indicates the number of launches during the calendar year for which vehicle performance was entirely normal in-so far as could be determined The clear white parts forming the tops of most bars show the number of launches that were either failures or flights where the launch vehicle experienced some sort of anomalous behavior Every launch with an- entry in the response mode column in Table 45 falls in this category Such behavior did not necessarily prevent the attainment of some or even all mission objectives 9/10/96 30 I 25 i Failu~e/An~maly I 11111 Nor1a1 Perormf nee I 20 ffl i i i i i 15 i i i i i i I i 10 I I I I I I I I I i i i 55 60 65 70 75 80 85 90 95 Launch Year Figure 39 Titan Launch Summary 148 RTI [PAGE 158] I I D.4.1 Titan Launch History The data in Table 45 summarizes all Titan and Titan-boosted space-vehicle launches since the program began A launch sequence number is provided in the first column A launch ID and date are provided in columns and The fourth column indicates the vehicle configuration The fifth column indicates the launch range The sixth column indicates the failure-response mode through and NA that RTI has determined best describes the failure that occurred For Mode or failures a suffix of indicates the vehicle tumbled Successful launches are indicated by a blank in the Response-Mode column The seventh column indicates the operational flight phase during which the failure occurred The last column indicates whether the vehicle configuration is representative of those being launched today Launches through sequence number 337 were used in the filtering process to estimate failure rate Table 45 Titan Launch Historv Launch Vehicle Test Response Flight Rep No Mission/ID Date Confiauratlon Ranae Mode Phase Conf Weapons System WSl 12/20/58 I ER ws 02/03/59 I ER ws 02/06/59 I ER ws 02/25/59 I ER ws 04/03/59 I ER ws 05/04/59 I ER ws 08/14/59 I ER ws 12/12/59 I ER ws 02/02/60 I B-7Al ER 10 ws 02/05/60 I ER 11 ws 02/24/60 I ER 12 ws 03/08/60 I C-11 ER 13 ws 03/22/60 I ER 2.5 14 ws 04/08/60 I C-51 ER 15 ws 04/21/60 I ER 16 ws 04/28/60 I ER 17 ws 05/13/60 I ER 18 ws 05/27/60 I G-91 ER 19 ws 06/24/60 I G-10 ER 20 ws 07/01/60 I ER 21 ws 07/28/60 I ER 22 ws 08/10/60 I ER 23 ws 08/30/60 I ER 24 ws 09/28/60 I ER 25 ws 09/29/60 I ER 26 ws 10/07/60 I ER 27 ws 10/24/60 I ER 28 ws 12/20/60 I ER 29 ws 01/20/61 I J-10 ER 30 ws 02/10/61 I J-11 ER 9/10/96 149 RTI [PAGE 159] Launch Vehicle Test Response Flight Rep No Mission/ID Date Configuration Ranae Mode Phase Cont 31 ws 02/20/61 J-13 ER 32 ws 03/03/61 J-12 ER 33 ws 03/28/61 J-14 ER 34 ws 03/31/61 J-15 ER 35 SILVER SADDLE 05/03/61 WR 36 ws 05/23/61 J-16 ER 37 ws 06/24/61 ER 38 ws 07/20/61 J-18 ER 39 ws 07/25/61 ER 40 ws 08/03/61 J-19 ER 41 ws 09/06/61 J-m ER 42 ws 09/07/61 ER 43 BIG SAM 09/23/61 SM-2 WR 44 ws 09/28/61 J-20 ER 45 ws 10/06/61 ER 46 ws 10/24/61 J-21 ER 47 ws 11/21/61 J-22 ER 48 ws 11/29/61 ER 49 ws 12/13/61 J-23 ER 50 ws 12/15/61 ER 51 DOUBLE MARTINI 01/20/62 SM-4 WR 52 ws 01/29/62 ER 53 BLUE GANDER 02/23/62 SM-18 WR 54 WS first Titan II 03/16/62 II ER 55 SILVER TOP 05/04/62 I SM-34 WR 56 ws 06/07/62 II ER 57 ws 07/11/62 II ER 58 ws 07/25/62 II ER 59 ws 09/12/62 II ER 60 TIGHT BRACELET 10/06/62 I SM-35 WR 61 ws 10/12/62 II ER 62 ws 10/26/62 II N-12 ER 63 YELLOW JACKET 12/05/62 I SM-11 WR 64 ws 12/06/62 II N-11 ER 65 ws 12/19/62 II N-13 ER 66 ws 01/10/63 II N-15 ER 67 TEN MEN 01/29/63 I SM-8 WR 68 ws 02/06/63 II N-16 ER 69 AWFUL TIRED 02/16/63 II WR 70 ws 03/21/63 II N-18 ER 2.5 71 YOUNG BLOOD 03/30/63 I SM-3 WR 72 HALF MOON 04/04/63 I WR 73 RAMP ROOSTER 04/13/63 I SM-1 WR 74 ws 04/19/63 II N-21 ER 75 DINNER PARTY 04/27/63 II WR 76 MARES TAIL 05/01/63 I WR 9/10/96 150 RTI [PAGE 160] Launch Vehicle Test Response Flight Rep No Mission/ID Date Confiauration Ranae Mode Phase Conf 77 ws 05/09/63 II CN-14 ER 78 FLYING FROG 05/13/63 II N-19 WR 79 ws 05/24/63 II N-17 ER 80 ws 05/29/63 II N-20 ER 81 THREAD NEEDLE 06/20/63 II N-22 WR 82 SILVER SPUR 07/16/63 I SM-24 WR 83 HIGH RIVER 08115/63 I SM-7 WR 84 ws 08/21/63 I N-24 ER 85 POLAR ROUTE 08/30/63 SM-56 WR 2.5 86 DAILY MAIL 09/17/63 SM-83 WR 87 TAR TOP 09/23/63 CN-23 WR 88 ws 11/01/63 N-25 ER 89 FIRETRUCK 11/09/63 N-27 WR 90 FACT RIDE 11/14/63 SM-68 WR 91 ws 12/12/63 N-29 EA 92 USEFUL TASK 12/16/63 N-28 WR 93 ws 01/15/64 N-31 ER 94 RED SAILS 01/23/64 I N-26 WR 95 SAFE CONDUCT 02/17/64 WR 96 ws 02/26/64 N-32 ER 97 APPLE PIE 03/13/64 N-30 WR 98 ws 03/23/64 CN-33 ER 99 SV GEMINI GT-1 04108/64 ER 100 ws 04109/64 N-34 ER 101 COBRA SKIN 07/30/64 B-28 WR 102 DOUBLE TALLEY 08/11/64 WR 103 GENTLE ANNIE 08/13/64 II 8-7 WR 104 SV first Titan Ill 09/01/64 IIIA 65-21 0)frrans ER 105 BLACK WIDOW 10/02/64 II 8-1 WR 106 HIGH RIDER 11/04/64 II B-32 WR 107 WESTWINDI 12/08/64 I SM-85 WR 108 sv 12/10/64 111A 65-209)/Trans ER 109 WEST WIND 111 01/14165 I SM-33 WR 110 SV GEMINI GT-2 01/19/65 II ER 111 SV LES-1 02/11/65 IIIA 65-211)/Trans ER 112 WEST WIND II 03/05/65 I SM-80 WR 113 SV GEMINI GT-3 03/23/65 II ER 114 ARTICSUN 03/24165 II B-60 WR 115 BEAR HUG 04116/65 II 845 WR 116 CARD DECK 04/30/65 II B-54 WR 117 SV LES-2 05/06/65 IIIA 65-214)/Trans ER 118 FRONT SIGHT 05/21/65 II B-51 WR 119 SV GEMINI GT 06/03/65 II ER 120 GOLD FISH 06/14/65 II B-22 WR 2.5 121 SV DUMMY PAYLOAD 06/18/65 IIIC 65-215)/Trans ER 122 BUSY BEE 06/30/65 II B-30 WR 9/10/96 151 RTI [PAGE 161] Launch Vehicle Test Response Flight Rep No Mission/ID Date Confiauration Range Mode Phase Cont 123 LONG BALL 07/21/65 11 B-62 WR 124 MAGIC LAMP 08/16/65 II WR 125 SV GEMINI GT-5 08/21/65 II ER 126 NEW ROLE 08/25/65 II B-19 WR 127 BOLD GUY 09/21/65 II B-58 WR 128 SV OV-2 LCS-5 10/15/65 IIIC 65-212)/Trans ER NA 4&5 129 POWER BOX 10/20/65 II B-33 WR 130 REDWAGON 11/27/65 11 B-20 WR 131 CROSS FIRE 11/30/65 II WR 132 SV GEMINI GT-7 12/04/65 II ER 133 SV GEMINI GT-6A 12/15/65 II ER 134 SV LES-3,4 OSCAR 12/21/65 IC 66-001)/Trans ER NA 135 SEA ROVER 12/22/65 B-73 WR 136 WINTER ICE 02/03/66 B-87 WR 137 BLACKHAWK 02/17/66 B-61 WR 138 SV GEMINI GT-8 03/16/66 ER 139 eLOSETOUeH 03/25/66 B-16 WR 140 GOLD RING 04/05/66 B-50 WR 141 LONG LIGHT 04/20/66 B-55 WR 142 SILVER BULLET- 05/24/66 B-91 WR 2.5 143 SV GEMINI GT-9A 06/03/66 ER 144 SV IDCSP 06/16/66 1110 6&-004)/Trans ER 145 SV GEMINI GT-10 07/18/66 II G-10 ER 146 GIANT TRAIN 07/22/66 II B-95 WR 147 DAILY MAIL 07/29/66 1118/AGENA 238 WR 148 SV-IDCSP 08/26/66 me 66-005)/Trans ER 149 SV GEMINI GT-11 09/12/66 II G-11 ER 150 BLACK RIVER 09/16/66 II B-40 WR 151 BUSY SCHEME 09/28/66 1118/AGENA 23B WR 152 SV-OAR/OV 11/03/66 me 66-002)/Trans ER 153 SV GEMINI GT-12 11/11/66 11 G-12 ER 154 BUBBLE GIRL 11/24/66 II B-68 WR 155 BUSY SKYROCKET 12/14/66 1118/AGENA 238 WR 156 SV-IDCSP/LES/DATS 01/18/67 IIIC 66-006)/Trans ER 157 BUSY PALEFACE 02/24/67 1118/AGENA 238 WR 158 GIFT HORSE 03/17/67 11 8-76 WR 159 GLAMOUR GIRL 04/12/67 11 B-81 WR 160 BUSY TAILOR 04/26/67 1118/AGENA 238 WR 161 SV-VELA/RSCH 04/28/67 Ille 66-003)/Trans ER 162 BUSY PLAYMATE 06/20/67 1118/AGENA 238 WR 163 BUGGY WHEEL 06/23/67 II 8-70 WR 164 SV-IDCSP 07/01/67 1110 66-007)/Trans ER 165 AFSC 08/16/67 1118/AGENA 238 WR 166 GLOWING BRIGHT 09/11/67 11 B-21 WR 167 AFSC 09/19/67 1118/AGENA 238 WR 168 AFSC 10/25/67 1118/AGENA 238 WR 9/10/96 152 RTI [PAGE 162] Launch Vehicle Test Response Flight Rep No Mission/ID Date ConfKJuration Ranae Mode Phase Conf 169 AFSC 12/05/67 1118/AGENA 238 WR 170 AFSC 01/18/68 11I8/AGENA 2381 WR 171 GLORY TRIP 02/28/68 11(13-88 WR 172 AFSC 03/13/68 I118/AGENA 238 WR 173 GLORY TRIP 10T 04/02/68 II 8-36 WR 174 AFSC 04/17/68 11I8/AGENA 238 WR 175 AFSC 06/05/68 1118/AGENA 238 WR 176 GLORY TRIP ST 06/12/68 II B-82 WR SV-IDCSP 06/13/68 1110 6&-009)/rrans ER 178 AFSC 08/06/68 I118/AGENA 238 WR 179 GLORY TRIP 18T 08/21/68 II 8-53 WR 180 AFSC 09/10/68 1118/AGENA 23B WR 181 SV-LES/OV 09/26/68 IIIC 65-213)/Trans ER 182 AFSC 11/06/68 1118/AGENA 238 WR 183 GLORY TRIP 26T 11/19/68 ll 8-3 WR 184 AFSC 12/04/68 111B/AGENA 23B WR 185 AFSC 01/22/69 1118/AGENA 23B WR 186 SV-TACCOM 02/09/69 IIIC-17/Trans ER 187 AFSC 03/04/69 1118/AGENA 238 WR 188 AFSC 04/15/69 I118/AGENA 238 WR 189 GLORY TRIP 39T 05/20/69 II WR 190 SV-VELA/OV 05/23/69 IIIC-15/Trans ER 191 AFSC 06/03/69 1118/AGENA 238 WR 192 AFSC 08/23/69 1118/AGENA 238-1 WR 193 AFSC 10/24/69 1118/AGENA 238-2 WR 194 AFSC 01/14/70 1118/AGENA 238-3 WR 195 SV-VELA 04/08/70 IIIC-18/Trans ER 196 AFSC 04/15/70 1118/AGENA 238-4 WR 197 AFSC 06/25/70 11I8/AGENA 238-5 WR 198 AFSC 08/18/70 11I8/AGENA 238-6 WR 199 AFSC 10/23/70 1118/AGENA 238-7 WR 200 SV-DOD 11/06/70 IIIC-19/Trans ER NA 3.5&5 201 AFSC 01/21/71 1118/AGENA 23B-81 WR 202 AFSC 03/20/71 III8/AGENA 338-1 WR 203 AFSC 04/22/71 1118/AGENA 23B-9 WR 204 SV-DOD 05/05/71 IIIC-20/Trans ER 205 AFSC 06115/71 111D 230-1 WR 206 M1-17 06/20/71 11 B-12 WR 207 AFSC 08/12/71 111B/AGENA 24B-1 WR 208 M2-1 08/27/71 II 8-100 WR 209 AFSC 10/23/71 111B/AGENA 248-2 WR 210 SV-DOD 11/02/71 IIIC-21/Trans ER 211 AFSC 01/20/72 1110 23D-2 WR 212 AFSC 02/16/72 III8/AGENA 338-2 WR 213 SV-DOD 03/01/72 llJC-22/Trans ER 214 AFSC 03/17/72 111B/AGENA 24B-31 WR 9/10/96 153 RTI [PAGE 163] Launch Vehicle Test Response Flight Rep No Mission/ID Date Confiauration Range Mode Phase Conf 215 AFSC 05/20/72 1118/AGENA 248-4 WR 216 M2-10 05/24/72 II B-46 WR 217 AFSC 07/07/72 1110 230-5 WR 218 AFSC 09/01/72 1118/AGENA 24B-5 WR 21·9 AFSC 10/10/72 1110 23D-3 WR 220 M2-14 10/11/72 11 B-78 WR 221 AFSC 12/21/72 1118/AGENA 24B-6 WR 222 AFSC 03/09/73 111D 230-6 WR 223 AFSC 05/16/73 1118/AGENA 248-7 WR 224 SV-DSP 06/12/73 IIIC-24/T rans ER 225 AFSC 06/26/73 1118/AGENA 24B-9 WR 226 AFSC 07/13/73 1110 230-7 WR 227 AFSC 08/21/73 1118/AGENA 33B-3 WR 228 AFSC 09/27/73 1118/AGENA 248-8 WR 229 M2-27 10/05/73 II WR 230 AFSC 11/10/73 1110 23D-8 WR 231 SV-DSCS 12/13/73 IIIC-26/T rans ER 232 SV-VIKING 02/11/74 IIIE/CENT D-1T TC-1 ER 233 AFSC 02/13/74 1118/AGENA 248-10 WR 234 M2-31 03/01/74 II WR 235 AFSC 04/10/74 1110 23D-9 WR 236 SV-ATS-F 05/30/74 IIIC-9/Trans ER 237 AFSC 06/06/74 1118/AGENA 24B-11 WR 238 AFSC 08/14/74 1118/AGENA 248-12 WR 239 AFSC 10/29/74 1110 230-4 WR 240 SV-HELIOS-A TC-2 12/10/74 IIIE/CENT-1T 23E-2 ER 241 SOFT-1 01/09/75 II WR 242 AFSC 03/09/75 1118/AGENA 348-1 WR 243 AFSC 04/18/75 1118/AGENA 248-14 WR 244 SV-DSCS 05/20/75 IIIC-7/Trans ER NA 2.5 245 AFSC 06/08/75 1110 230-10 WR 246 DG-2 08/07/75 II WR 247 SV-Vikina/Mars TC-4 08/20/75 HIE/CENT D-1T 23E-4 ER 248 SV-Vikina/Mars TC-3 09/09/75 IIIE/CENT D-1T 23E-3 ER 249 AFSC 10/09/75 1118/AGENA 248-10 WR 250 AFSC 12/04/75 111D 230-13 WR 251 OG-4 12/04/75 II WR 252 SV-DSP 12/14/75 IIIC-29/Trans ER NA 253 SV-HELIOS-B TC-5 01/15/76 IIIE/CENT D-1T 23E-5 ER 254 SV-LES/SOLRAD 03/14/76 111 C-30/Trans ER 255 AFSC 03/22/76 111B/AGENA 23B-18 WR 256 AFSC 06/02/76 111B/AGENA 34B-5 WR 257 SV-DSP 06/25/76 IIIC-28/Trans ER 258 ITF-1 06/27176 II WR 259 AFSC 07/08/76 111D 230-14 WR 260 AFSC 08/06/76 111B/AGENA 34B-6 WR 9/10/96 154 RTI [PAGE 164] Launch Vehicle Test Response Flight Rep No Mission/ID Date Confiauration Ranae Mode Phase Conf 261 AFSC 09/15176 1118/AGENA 248-17 WR NA 262 AFSC 12/19/76 IIID 23D-15 WR 263 SV-DSP 02/06m IIIC-23/Trans ER 264 AFSC 03/13m 1118/AGENA 248-19 WR 265 SV-DSCS 05/12/77 IIIC-32/Trans ER 266 AFSC 06/21m IIID 230-17 WR 267 SV-VOYAGER rrc-n o8/20m IIIE/CENT D-1T 23E-7 ER 268 SV-VOYAGER TC-6 09/05/77 IIIE/CENT O-1T 23E-6 ER NA 269 AFSC 09123m 1118/AGENA 248-23 WR 270 AFSC 02/24/78 1118/AGENA 348-2 WR 271 AFSC 03/16/78 IIID 23D-20 WR 272 SV-OSCS 03/25178 IIIC-35/Trans ER 273 SV-OOD 06/10/78 IIIC-33/Trans ER 274 AFSC 06/14/78 1110 230-18 WR 275 AFSC 08/04/78 1118/AGENA 348-7 WR 276 SV-DSCS 12/13/78 IIIC-36/Trans ER AFSC 03/16179 1110 23D-21 WR 278 AFSC 05/28/79 1118/AGENA 248-25 WR 279 SV-DSP 06/10/79 IIIC-23C-13/Trans ER 280 SV-O0D 10/01/79 IIIC-23C-16/Trans ER 281 SV-OSCS 11/21/79 IIIC-23C-19/Trans ER 282 AFSC 02/06/80 IUD 230-19 WR 283 AFSC 06/18/80 111D 23D-16l WR 284 AFSC 12/13/80 1118/AGENA 348-3 WR 285 AFSC 02/28/81 1118/AGENA 248-24 WR 286 SV-OOD 03/16/81 IIIC-23C-22/Trans ER 287 AFSC 04/24/81 1118/AGENA 1348-8 WR 288 AFSC 09/03/81 1110 230-22 WR 289 SV-OOD 10/31/81 IIIC-23C-21/Trans ER 290 AFSC 01/21/82 1118/AGENA 248-26 WR 291 SV-00D 03/06/82 IIIC-23C-20/Trans ER 292 AFSC 05/11/82 111D 23D-24 WR 293 SV-DSCS 10/30/82 340-01AUS ER 294 AFSC 11/17/82 111D 230-23 WR 295 AFSC 04/15/83 1118/AGENA 248-27 WR 296 AFSC 06/20/83 340-5 WR 297 AFSC 07/31/83 1118/AGENA 348-9 WR 298 SV-00O 01/31/84 34D 10/Trans ER 299 SV-00O 04/14/84 340-11 Trans ER 300 AFSC 04/17/84 1118/AGENA 248-281 WR 301 AFSC 06/25/84 34D-4 WR 302 AFSC 08/28/84 1118/AGENA 348-4 WR 303 AFSC 12/04/84 34D-6 WR 304 SV-DOD 12/22/84 34D-13/Trans ER 305 AFSC 02/07/85 1118/AGENA 348-10 WR 306 AFSC 08/28/85 340-7 WR 9/10/96 155 [PAGE 165] Launch Vehicle Test Response Flight Rep No Mission/ID Date Confiauratlon Ranae Mode Phase Conf 307 AFSC 04/18/86 34D-9 WR 308 AFSC 02/11/87 1118/AGENA 348-11 WR 309 AFSC 10/26/87 340-15 WR 310 SV-00D 11/29/87 34D-8/Trans ER 311 SV-D00 09/02/88 34D-3/Trans ER NA 312 AFSC 09/05/88 11/SLV 23G-1 WR 313 AFSC 11/06/88 340-14 WR 314 SV-000 05/10/89 340-16/frans ER 315 SV first T-IV 06/14189 IV-1/IUS ER NA 316 SV-DOD 09/04/89 340-2/Trans ER 317 AFSC 09/05/89 11/SLV 23G-2 WR 318 SV-JAPAN/UK 01/01/90 Ill ER 319 SV-INTELSAT VI 03/14/90 Ill ER NA 2.5&5 320 SV-D00 06/08/90 IV-4 ER 321 SV-INTELSAT VI 06/23/90 Ill ER 322 SV-000 11/13/90 IV-6/IUS ER 323 AFSC 03/08/91 IV WR 324 AFSC 11/17/91 IV WR 325 AFSC 04/25/92 ll/SLV WR 326 SV-MARS OBS 09/25/92 Ill ER 327 AFMC 11/28/92 IV WR 328 AFMC 08/02/93 IV K-11 WR 329 LANDSAT6 10/05/93 11/SLV WR 330 CLEMENTINE 01/25/94 11/SLV WR 331 SV-MILSTAR 02/07/94 TIV-CENTAUR 10 ER 332 SV-D00 05/03/94 TIV-CENTAUR ER 333 SV-DOD 08/27/94 TIV-CENT AUR ER 334 SV-D00 12122194 IV-IUS K-14 ER 335 SV-D00 05/14/95 TIV-CENTAUR K-23 ER 336 SV-D00 07/10/95 TIV-CENTAUR K-19 ER 337 SV-MILSTAR 11/06/95 TIV-CENTAUR K-21 ER 338 DOD 04/24/96 TIV-CENTAUR K-16 ER 339 DOD 07/02/96 TIV-NUS ER 9/10/% 156 RTI [PAGE 166] D.4.2 Titan Failure Narratives The following narratives provide available details about each Titan failure since the beginning of the Titan I program in 1959 The narratives are numbered to match the flight-sequence numbers in Section D.4.1 14 Aug 59 Response Mode Flight Phase Umbilicals were prematurely pulled from missile resulting in engine shutdown and impact on pad 12 Dec 59 Response Mode Flight Phase Missile destroyed itself just before liftoff 10 Feb 60 Response Mode Flight Phase While pitch program was in progress a structural failure occurred in transition section Nose cone broke off and missile lost aerodynamic stability Shortly after an explosion and fire destroyed the missile 12 Mar 60 Response Mode Flight Phase Failure of gas-generator valve to open prevented Stage-II ignition 13 22 Mar 60 Response Mode Flight Phase 2.5 Premature shut down of vernier engines resulted in impact 38 miles short of target 14 Apr 60 Response Mode Flight Phase Although Stage-I performance was low Stage II successfully separated and ignited All data were lost about 50 seconds later apparently due to malfunction of Stage II turbopump 20 Jul 60 Response Mode Flight Phase Shortly after launch hydraulic power to engine actuators was lost so control could not be maintained The missile veered northwest and pitched down Flight azimuth was 105.97° Missile was destroyed by RSO 11 seconds after liftoff 21 28 July 60 Response Mode Flight Phase Stage I thrusting flight was terminated prematurely at 101 seconds Nominal 136 seconds Stage II engine did not start apparently because the auxiliary turbopumps did not receive sufficient head pressure to effect a successful start 22 10 Aug 60 Response Mode Flight Phase Stage II engine shutdown 0.17 seconds early and solo vernier operation did not occur Impact was 107 miles short of target 25 29 Sep 60 Response Mo.de Flight Phase Stage I shut down prematurely when a low-level sensor malfunctioned and ceased to be locked out Stage II performed properly but shutdown prematurely due to propellant depletion The impact was some 3600 miles short of the 8700-mile target point 9/10/96 157 RTI [PAGE 167] 28 20 Dec 60 Response Mode Flight Phase No Stage-Ilignition due to failure of gas generator to start 29 J-10 20 Jan 61 Response Mode Flight Phase No- Stage-II operation due to erroneous signal that appeared at umbilical disconnect Impact some 420 miles downrange 32 J-12 Mar 61 Response Mode Flight Phase Stage-II terminated prematurely after 54-second burn apparently due to failure of pump drive assembly Impact was 730 miles downrange 34 J-15 31 Mar 61 Response Mode Flight Phase Booster shut down prematurely at seconds Missile subsequently tumbled and broke up 37 24 Jun 61 Response Mode Flight Phase Stage II engine shut down prematurely after 12 seconds of operation due to loss of Stage II hydraulic power Loss of hydraulic power occurred during Stage I flight so failure led to loss of control of sustainer and vernier actuators producing excessive missile motion and tumbling 42 Sep 61 Response Mode Flight Phase A transient in guidance computer at 218.35 seconds SECO at 297.7 seconds caused impact 20 miles short and 2.8 miles left of target 45 Oct 61 Response Mode Flight Phase A one-bit error in the velocity accumulation caused impact 86 miles short and 14 miles right of target 50 15 Dec 61 Response Mode Flight Phase Start signal for Stage II was not generated Stage II did not ignite 51 I 20 Jan 62 Response Mode Flight Phase Missile self-destructed apparently after Stage failed to ignite A backup automatic fuel-cutoff signal was sent at 248 Seconds 53 I 23 Feb 62 Response Mode Flight Phase Missile sell-destructed apparently after Stage failed to ignite A backup automatic fuel cutoff signal was sent at 240 Seconds 56 Jun 62 Response Mode Flight Phase Sustainer engine performance was subnormal due to reduced oxidizer flow through the gas generator RSO terminated flight after a prolonged sustainer bum Impact only 1100 miles downrange 58 25 July 62 Response Mode Flight Phase After about 60 seconds of Stage II bum a fuel leak between the thrust chamber valve and the injector resulted in a 9/10/96 158 RTI [PAGE 168] 50% reduction of sustainer thrust for remainder of Stage II operation Impact was 2888 miles short of target 63 I Yellow Jacket Dec 62 Response Mode Flight Phase Missile was command destructed at 250 seconds No other data available 64 N-11 Dec 62 Response Mode Flight Phase Stage I shut down 11.4 seconds early As a result no inertial velocity-dependent discretes were issued and Stage II shut down prematurely apparently due to an oxidizer bootstrap-line failure 66 N-15 10 Jan 63 Response Mode Flight Phase Stage II flight was terminated by backup SECO approximately 34 seconds after ignition because low thrust caused velocity to fall below performance criteria Cause of low thrust was reduced oxidizer flow through the gas-generator injector Impact only 556 miles downrange 68 N-16 Feb 63 Response Mode Flight Phase Oxidizer depletion prior to normal SECO resulted in impact 71 miles short of target 69 Awful Tired 16 Feb 63 Response Mode Flight Phase Missile self- destructed at 56 seconds at an altitude of 18,000 feet due to loss of roll control Failure was caused by improper umbilical release at launch and subsequent loss of vehicle electrical control 70 N-18 21 Mar 63 Response Mode Flight Phase 2.5 Although vernier ignition was normal vernier received no commands and gimbaled erratically 2.8 seconds later R/V attitude was incorrect at separation so that impact was to miles short of target 74 N-21 19 Apr 63 Response Mode Flight Phase Stage II engine shut down prematurely due to oxidizer bootstrap-line failure 76 Titan I Mares Tail May 63 Response Mode Flight Phase The missile was erratic from liftoff as one engine either failed at liftoff or shutdown immediately thereafter The missile rose about 50 feet then fell uprange from the launch pad about 7.5 seconds after liftoff 77 N-14 May 63 Response Mode Flight Phase Oxidizer depletion due to a leak resulted in premature Stage II shutdown and impact short of target 80 N-20 29 May 63 Response Mode Flight Phase A fuel leak in Stage I engine compartment at ignition caused a fire that spread through the engine compartment Stage I destroyed itself at 52 seconds Stage II was destroyed by RSO 9/10/96 159 RTI [PAGE 169] 81 Titan II Thread Needle 20 June 63 Response Mode Flight Phase Flight appeared normal until BECO at about 146 seconds The staging event seemed abnormally long due to low second-stage thrust that remained considerably below normal thereafter because of reduced oxidizer flow through the gas- generator injector The vehicle nevertheless followed closely to the intended ground track albeit well behind schedule At about 480 seconds and some three minutes behind schedule the missile began a slow turn to the left A SECO indication was noted about 10 seconds later Destruct was sent at 532 seconds after all track was lost 82 Titan I Silver Spur 16 July 63 Response Mode Flight Phase The flight was normal through first-stage cutoff Separation occurred but the second~stage failed to ignite 85 Titan I Polar Route 30 Aug 63 Response Mode Flight Phase 2.5 The flight appeared normal through the first and second-stage thrusting periods At SECO the vernier engines also shut down apparently due to shutdown of the gas generator 89 II Fire Truck Nov 63 Response Mode Flight Phase Missile tumbled out of control at 130 seconds then broke up 104 IHA 65-210 Sep 64 Response Mode Flight Phase Nominal mission through first transtage burn Transtage propellant-tank pressurization system failed with resultant reduction in thrust Vehicle impacted about 2700 miles downrange 107 Titan I West Wind I Dec 64 Response Mode Flight Phase A first-stage power-level malfunction combined with guidance deviations caused the missile to drift far to the left then over-correct far to the right passing north of Midway Is No other data available 109 Titan I West Wind III 14 Jan 65 Response Mode Flight Phase First-stage flight was apparently normal but second stage failed to ignite 112 Titan I West Wind II Mar 65 Response Mode Flight Phase Missile impacted on azimuth about 80 miles short of target due to propellant depletion 116 Titan I Card Deck 30 Apr 65 Response Mode Flight Phase Flight appeared normal until around 100 seconds when the IP slowed and then stopped due to a turbopump failure The missile self-destructed at about 115 seconds with the impact point about 115 miles offshore 120 Titan II Gold Fish 14 Jun 65 Response Mode Flight Phase 2.5 Vehicle apparently failed during the vernier solo phase due to·loss of a vernier nozzle 9/10/96 160 RT [PAGE 170] 127 Titan II Bold Guy 21 Sep 65 Response Mode Flight Phase After a normal first-stage flight the second stage was shut down immediately after start by an erroneous guidance command 128 IIIC 65-212 15 Oct 65 Response Mode NA Flight Phase and Normal mission through transtage second ignition and bum One chamber of transtage engine failed to shutdown completely resulting in a pitch-up deviation loss of control vehicle tumbling and an unplanned orbit 131 Titan II Cross Fire 30 Nov 65 Response Mode Flight Phase Trouble apparently began between 208 and 214 seconds when the rate and track beacons were lost The radar tracked till about 360 380 seconds indicating a ballistic- type trajectory veering to the right Loss of control was due to a fuel leak at the crossover manifold 134 IIIC 66-001 21 Dec 65 Vehicle Response Mode NA Flight Phase Nominal mission through transtage second burn shutdown Attitude control system engine failed to shutdown following vernier bum with resulting fuel depletion and loss of attitude control 135 Titan II Sea Rover 22 Dec 65 Response Mode Flight Phase Flight was apparently normal until some point well into second-stage bum Track then indicated erratic movement left of nominal then right of nominal but with little downrange movement of the IP Automatic fuel cutoff was sent at 396 seconds Failure resulted from improper rigging of sustainer actuator that exceeded control-system capability 142 Titan II Silver Bullet 24 May 66 Response Mode Flight Phase 2.5 Flight was normal except that R/V did not separate causing a 20-mile uprange miss 148 IIIC 66-005 26 Aug 66 Vehicle 12 Response Mode Flight Phase Payload fairing failed during Stage-0 powered flight The failure at 79 seconds resulted in violent maneuvering and self destruct ISDS 159 Titan II Glamour Girl 12 Apr 67 Response Mode Flight Phase First-stage flight was normal About 15 seconds after second-stage ignition failure of the yaw-rate gyro resulted in violent roll and pitch maneuvers Missile impacted about 660 miles downrange 160 IIIB Agena Busy Tailor 26 Apr 67 Response Mode Flight Phase Flight appeared normal through first-stage cutoff and separation About 15 seconds into the second stage a fuel-line blockage resulted in a drop in chamber pressure that reduced the thrust to about half its normal level As a result the velocitv eventually stopped increasing The IP moved slightly farther downrange and remained on azimuth until loss of signal at 300 seconds Impact was about 600 miles downrange 9/10/96 161 RTI [PAGE 171] 200 IIIC-19 Nov 70 Vehicle 19 Response Mode NA Flight Phase 3.5 and All booster systems performed essentially as planned Transtage experienced a guidance anomaly during coast prior to second bum resulting in an improper orbit 212 IIIB Agena AFSC 16 Feb 72 Response Mode Flight Phase After an apparently normal Titan III boost phase the Agena failed to- ignite The payload impacted about 1500 miles downrange 232 Titan IIIE #El 11 Feb 74 Response Mode Flight Phase All Titan booster functions and Centaur separation were properly performed Centaur stage failed to ignite 244 TIIIC-25 20 May 75 Vehicle 25 Response Mode NA Flight Phase 2.5 All systems performed satisfactorily through Stage 11/111 separation About 230 milliseconds after staging discrete was issued the IMU power supply failed Transtage then tumbled and the first transtage bum failed to occur leaving transtage and attached payload in the parking orbit 252 TIIIC-29 14 Dec 75 Vehicle 29 Response Mode NA Flight Phase All launch vehicle objectives were met However satellite propulsion system malfunctioned putting satellite in uncontrollable position with no possibility of restoring mission capability 261 111B Agena AFSC 15 Sep 76 Response Mode Flight Phase The stage-2 engine failed to respond to shutdown commands and thus burned to propellant depletion Cause was thought to be a hard contaminant that blocked the fuel valve 268 23E-6/Centaur D-lT Sep 77 Response Mode NA Flight Phase Flight was regarded as a success although the second-stage velocity was low probably due to a detached line diffuser lodged on top of the prevalve 272 TIIIC-17 25 Mar 78 Vehicle 35 Response Mode Flight Phase Vehicle performance was satisfactory until 16.4 seconds beyond Stage-2 start At this time the Stage-2 hydraulic system began and continued over-pressurizing until the system burst after 125 seconds of Stage-2 operation The pressure then dropped to zero the vehicle tumbled out of control and guidance shut down the second stage after detecting negative acceleration The RSO sent arm at 629 seconds and destruct at 630 seconds 306 34D AFSC 28 Aug 85 Response Mode Flight Phase The first-stage engine suffered three separate major anomalies during subassembly-2 start transient 110 sec a large oxidizer leak of 165 lb/sec occurred in the oxidizer suction line at 213 seconds an internal fuel leak of 30 lb/sec occurred in downstream of the combustion chamber and created a vehicle side force the 9/10/96 162 RTI [PAGE 172] shut down at 213 sec due to failure of its turbopump assembly The vehicle continued flight till 221 seconds when erratic attitude rates were noted At 229 seconds the impact point stopped At 257 seconds the pressure dropped to zero in the stage-1 thrust-chamber assembly At the same time stages and separated as stage ignited After this time stage-2 attitude rates were erratic Destruct was sent by the RSO at 273 seconds 307 34D AFSC 18 Apr 86 Response Mode Flight Phase At about 8.8 seconds after liftoff the insulation and case of SRM No debonded resulting in case rupture immediately thereafter The core vehicle was destroyed by fragments from the ruptured motor Auto-destruct was activated on SRM-1 at 9.0 seconds 311 34D-3/Transtage Sep 88 Response Mode NA Flight Phase Transtage pressurization system failed due to damage to the upper portion of the transtage fuel tank and pressurization lines A leak of 1,340 pounds occurred during park orbit and a large helium-tank gas leak occurred during transtage first burn Not enough helium was left in system to allow start of second bum The payload was left in a geostationary transfer orbit 315 Titan IV-1/IUS 14 June 89 Response Mode NA Flight Phase Late in Stage-1 burn one of the engines failed and shut down The other engine was able to gimbal sufficiently to maintain control until propellant depletion Trajectory inaccuracies were compensated for during Stage-2 burn and the mission was a success 319 Commercial Titan 14 Mar 90 Response Mode NA Flight Phase 2.5 and Boost phase was satisfactory The payload separation system was designed for two satellites and had two discrete outputs from the missile guidance computer MGC but for this mission it carried only a single satellite The wiring team miswired the harness which connected the MGC payload-separation discretes to the payload separation device so the satellite never received the separation signal PKM and satellite did not separate from Stage II resulting in low-earth elliptical orbit Ground controllers were able to separate satellite hours later but PKM remained attached to Stage II 328 IV Aug 93 Response Mode Flight Phase A leak occurred in SRM#l at 99.9 seconds that rapidly enveloped the vehicle in propellant gases Approximately 1.6 seconds later the vehicle blew up and disintegrated apparently due to activation of the inadvertent-separation destruct system Destruct was transmitted at 104.5 seconds 329 II/SLV Landsat Oct 93 Response Mode Flight Phase Following a successful Titan-II second-stage burn and after payload separation the apogee- kick motor failed to ignite and circularize the highly-elliptical orbit The Landsat payload and Titan II followed a ballistic trajectory back into the atmosphere where bumup occurred 9/10/96 163 RTI [PAGE 173] Thor Launch and Performance History Not Including Delta The entire Thor history is depicted rather compactly in bar-graph form in Figure 40 The solid-black portion of each bar indicates the number of launches during the calendar year for which vehicle performance was entirely normal in so far as could be determined The clear white parts forming the tops of most bars show the number of launches that were either failures or flights wher the launch vehicle experienced some sort of anomalous behavior Every launch with an entry in the response mode column of Table 46 falls in this category Such behavior did not necessarily prevent the attainment of some or even all mission objectives 35 30 25 en Cl 20 55 60 65 70 75 80 85 90 95 Launch Year Figure 40 Thor Launch Summary D.5.1 Thor and Thor-Boosted Launch History The data in Table 46 summarize all Thor and Thor-boosted space-vehicle launches since the program began A launch sequence number is provided in the first column A launch ID and date are provided in- columns and The fourth column indicates the vehicle configuration The fifth column indicates the launch range The sixth column indicates the failure-response mode through and NA that RTI has determined best describes the failures that occurred For Mode or failures a suffix of indicates the vehicle tumbled Successful launches are indicated by a blank in the Response- 9/10/96 164 RTI [PAGE 174] Mode column The seventh column indicates the operational flight phase during which the failure occurred The last column indicates whether the vehicle configuration is representative of those being launched today Table 46 Thor Launch History Launch Vehicle Test Response Flight Rep No Mission/ID Date Confiauration Ranae Mode Phase Cont Weapons System WS 01/25/57 101 ER ws 04/19/57 102 ER ws 05/21/57 103 ER ws 08/30/57 104 ER ws 09/20/57 105 ER ws 10/03/57 107 ER ws 10/11/57 108 ER ws 10/24/57 109 ER ws 12/07/57 112 ER 10 ws 12/19/57 113 ER 1.5 11 ws 01/28/58 114 ER 12 ws 02/28/58 120 ER 13 ws 04/19/58 121 ER 14 ws 04/23/58 ABLE I 116 ER 15 ws 06/04/58 115 ER 16 ws 06/13/58 122 ER 17 ws 07/11/58 ABLE I 118 ER 18 ws 07/12/58 123 ER 19 ws 07/23/58 ABLE I 119 ER 20 ws 07/26/58 126 ER 21 ws 08/06/58 117 ER 22 PIONEER 08/17/58 ABLE I 127 ER 23 PIONEER-I 10/11/58 ABLE I 130 ER NA 2&5 24 ws 11/05/58 138 ER 25 PIONEER-II 11/08/58 ABLE I 129 ER 26 ws 11/26/58 140 ER 27 ws 12/05/58 145 ER 28 ws 12/16/58 146 ER 29 ws 12/30/58 149 ER 30 ws 01/23/59 ABLE 11(128 ER 1.5 31 ws 01/30/59 154 ER 32 ws 02/28/59 ABLE II 131 ER 33 ws 03/21/59 ABLE II 132 ER 34 ws 03/21/59 158 ER 35 ws 03/26/59 162 ER 36 ws 04/07/59 ABLE II 133 ER 37 ws 04/22/59 176 ER 38 ws 04/24/59 164 ER 39 ws 05/12/59 187 ER 40 ws 05/21/59 ABLE II 135 ER 41 ws 05/22/59 184 ER 9/10/96 165 RT [PAGE 175] Launch Vehicle Test Response Flight Rep No Mission/ID Date Confiauration Ranae Mode Phase Conf 42 ws 06/11/59 ABLE 11 137 ER 43 ws 06/25/59 198 ER 44 ws 06/29/59 194 ER NA 1.5 45 ws 07/21/59 203 ER 46 ws 07/24/59 202 ER 47 ws 08/05/59 208 ER 48 EXPLORERS 08/07/59 ABLE HI 134 ER 49 ws 08/14/59 204 ER 50 ws 08/27/59 216 ER 51 ws 09/12/59 217 ER 52 TRANSIT 09/17/59 ABLE 136 ER 2.5 53 ws 09/22/59 222 ER 54 ws 10/06/59 235 ER 55 ws 10/13/59 221 ER 56 ws 10/28/59 230 ER 57 ws 11/03/59 238 ER 58 ws 11/19/59 244 ER 59 ws 12/01/59 254 ER 60 ws 12/17/59 255 ER 61 ws 01/14/60 256 ER 62 ws 02/09/60 259 ER 63 ws 02/29/60 263 ER 64 PIONEER-5 03/11/60 ABLE 219 ER 65 TIROSI 04/01/60 ABLE 148 ER 66 TRANSIT-1B 04/13/60 ABLE-ST AR 257 ER NA 1&5 67 TRANSIT-2A 06/22/60 ABLE-STAR 281 ER NA 2&5 68 COURIER-1A 08/18/60 ABLE-STAR 262 ER 69 COURIER-1B 10/04/60 ABLE-ST AR 293 ER 70 TRANSIT-3A 11/30/60 ABLE-STAR 283 ER 71 TRANSIT-3B 02/21/61 ABLE-STAR 313 ER NA 4&5 72 TRANSIT-4A 06/28/61 ABLE-STAR 315 ER 73 TRANSIT-4B 11/15/61 ABLE-STAR 305 ER 74 BIG SHOT-1 sutrorb 01/15/62 337 ER 75 COMPOSITE-1 01/24/62 ABLE-STAR 311 ER 76 ws 05/02/62 177 ER 77 ANNA-1A 05/10/62 ABLE-STAR 314 ER 78 BIG SHOT-II sutrorb 07/18/62 338 ER 79 ANNA-1B 10/31/62 ABLE-STAR 319 ER 80 ASSET ASV-1 09/18/63 232 ER 81 ASSET ASV-2 03/24/64 240 ER 82 ASSET ASV-3 07/22/64 250 ER 83 ASSET AEV-1 10/27/64 260 ER 84 ASSET AEV-2 12/08/64 SLV II 247 ER 85 ASSET ASV-4 02/23/65 248 ER 9/10/96 166 RTI [PAGE 176] D.5.2 Thor and Thor-Boosted Failure Narratives The following narratives provide information about flight failure of Thor weapons system and Thor-boosted space vehicle launches beginning with the first Thor launch in January 1957 The narratives are numbered to match the flight-sequence numbers in Section D.5.1 101 25 Jan 57 Response Mode Flight Phase Failure of fuel-system valve resulted in loss of thrust Missile fell back on pad after reaching an altitude of only inches 102 19 Apr 57 Response Mode Flight Phase Missile was apparently performing normally until destroyed by the RSO at 34.7 seconds Erroneous DOV AP beat-beat plot showed missile heading uprange 103 21 May 57 Response Mode Flight Phase Missile was destroyed on the pad at minutes A faulty fuel-tank regulator and relief valve resulted in ov~r-pressurizing and bursting of fuel tank 104 30 Aug 57 Response Mode Flight Phase Spurious signals in the main- engine yaw fe~dback circuit resulted in missile breakup shortly after 92 seconds 105 20 Sep 57 Response Mode Flight Phase Premature propellant depletion resulted in impact some 400 miles short of target 107 Oct 57 Response Mode Flight Phase Main fuel valve closed 1.25 seconds after liftoff Missile fell back on pad after reaching an altitude of about 17 feet 108 11 Oct 57 Response Mode Flight Phase Due to a mechanical failure an abnormal main-engine shutdown one second early resulted in loss of the vernier solo phase 112 Dec 57 Response Mode Flight Phase An electrical-system failure at 107 seconds produced an abnormal loading on the missile converter The missile began deviating at 110 seconds and finally broke up at about 224 seconds well after MECO at 156 seconds Missile impacted 200 miles downrange and 40 miles left of flight line 10 113 19 Dec 57 Response Mode Flight Phase 1.5 Flight was regarded as successful although there was no vernier solo operation and impact was miles from target 11 114 28 Jan 58 Response Mode Flight Phase Guidance system failure at 95 seconds resulted in erroneous steering commands causing the vehicle to yaw left and pitch down Divergence began about 110 seconds and continued until the 9/10/96 167 RT [PAGE 177] vehicle was destroyed by the RSO at 152 seconds Missile impacted about 60 miles downrange 12 120 28 Feb 58 Response Mode Flight Phase Failure of fuel line caused premature main engine shutdown at 109.7 seconds 13 121 19 Apr 58 Response Mode Flight Phase Failure of fuel system resulted in loss of thrust shortly after liftoff Missile fell back on pad after reaching an altitude of about feet 14 116 Able I 23 Apr 58 Response Mode Flight Phase A turbopump failure at 146.2 seconds resulted in main-engine shutdown and an explosion 18 123 11 July 58 Response Mode Flight Phase Although the flight was regarded as a success the main engine failed to respond to the guidance shutdown command due to a wiring failure When the main engine was shut down 0.43 seconds later by a backup command the vernier engines also shut down A large overshoot resulted from the late shutdown 20 126 26 July 58 Response Mode Flight Phase An inadvertent closing of the main-engine- liquid-oxygen valve terminated thrust at 58.4 seconds Missile components were recovered about miles downrange 22 127 Able I 17 Aug 58 Response Mode Flight Phase A turbopump failure led to main engine shutdown at about 74 seconds An explosion followed with impact about 10 miles downrange 23 130 Pioneer I 11 Oct 58 Response Mode NA Flight Phase Cow upper- stage thrust reduced the planned orbital altitude from 250,000 nm to 90,000 nm 24 138 Nov 58 Response Mode Flight Phase Shortly after liftoff the missile began drifting uprange and to the left reaching a maximum uprange drift of 150 feet It continued diverging to the left of the nominal flight path until a pitch-gyro failure caused an excessive pitch down Shortly thereafter at 34.6 seconds command destruct occurred 25 129 Able I Nov 58 Response Mode Flight Phase After a normal boost phase the third-stage Allegheny Ballistic X-248-A3 solid-propellant motor failed to ignite 26 140 26 Nov 58 Response Mode Flight Phase Erratic performance of the guidance-system inverter at 111.4 seconds resulted in erroneous accelerometer scale factors and a 37 mile overshoot of target Flight was regarded as a success 27 145 Dec 58 Response Mode Flight Phase Although the flight was considered successful below-normal thrust throughout flight resulted in fuel 9/10/96 168 RTI [PAGE 178] depletion before to reaching cutoff conditions Impact was 28 miles short of target 28 146 16 Dec 58 Response Mode Flight Phase Although flight was considered a success the main-engine fuel valve remained partially open for 14 seconds after MECO command was given This resulted in a 6-mile overshoot 29 149 30 Dec 58 Response Mode Flight Phase A momentary ground in the electrical system at liftoff caused the guidance system to assume control at this time rather than the planned 108.5 seconds Guidance immediately commanded a maximum pitch rate to place the missile in its proper orientation for 108.5 seconds By 22 seconds the missile has pitched through 46° As it attempted to maintain stability a reverse pitch subsequently developed but by 46.4 seconds the missile was tumbling to the right Destruct was sent at 52.5 seconds 30 128 Able 11 22 Jan 59 Response Mode Flight Phase 1.5 An electrical failure prevented second-stage Aerojet General AJl0-42 separation and ignition 31 154 30 Jan 59 Response Mode Flight Phase Improper propellant mixture and low thrust resulted in fuel depletion before cutoff conditions were reached 32 131 Able II 28 Feb 59 Response Mode Flight Phase Flight appeared normal until 195 seconds when all track was lost As a result the RSO sent cutoff at 218 seconds and destruct at 222 seconds 44 194 29 June 59 Response Mode NA Flight Phase 1.5 Flight was normal except that reentry vehicle did not separate and retro rockets did not fire 45 203 21 July 59 Response Mode Flight Phase The liftoff pin failed to extract so the pitch and roll programs were not initiated Missile was destroyed at 45 seconds at an altitude of about 18,000 feet 52 136 Transit 17 Sep 59 Response Mode Flight Phase 2.5 First and second stages performed normally until stage 2/3 separation Failure of the stage-2 retro system apparently led to a collision of the stages As a result the third stage failed to ignite 59 254 Dec 59 Response Mode Flight Phase A hydraulic-system failure resulted in premature closure of the main-engine liquid-oxygen valve The hydraulic-system pressure decayed almost linearly from seconds to 146 seconds when missile control was lost Impact was 322 miles short of target 66 257 Transit 13 Apr 60 Response Mode NA Flight Phase and The flight was a partial success although satellite was placed in a lower-than-planned orbit MECO velocity was 315 ft/sec below normal Noisy data rejected by the guidance computer resulted in pitch-plane steering errors and the unplanned orbit 9/10/96 169 RTI [PAGE 179] 67 281 Transit 22 June 60 Response Mode NA Flight Phase and Although boost phase was normal anomalous performance during second-stage bum produced an orbit with apogee of 570 miles and perigee of 341 miles instead of the planned 500-mile circular orbit 68 262 Courier lA 18 Aug 60 Response Mode Flight Phase Hydraulic pressure began a steady decay beginning about 18 seconds after liftoff Severe transients were noted at 129.3 seconds Uncontrolled yaw pitch and roll maneuvers began about 133 seconds Between 138 and 143 seconds the missile turned through three full revolutions in pitch The upper stages separated at 140.4 seconds and the first stage broke up about 142.8 seconds The second stage remained intact and was beacon tracked until 400 seconds 70 283 Transit 30 Nov 60 Response Mode Flight Phase The first stage shut down 11.2 seconds prematurely at 151.85 seconds when the MECO cutoff circuit was armed Since velocity at that time was about 2500 ft sec below the normal cutoff velocity portions of the first stage impacted in Cuba The second stage separated and performed normally until shut down by the RSO at MECO plus 159 seconds to prevent overflight of South America 71 313 Transit 21 Feb 61 Response Mode NA Flight Phase and Second bum of second stage failed to occur This resulted in an orbit with perigee of 539 miles and apogee of 92 miles instead of the planned 500-mile circular orbit 75 311 Composite I 24 Jan 62 Response Mode Flight Phase Flight was within acceptable limits until second-stage ignition Probably because of rupture of the lower oxidizer manifold normal thrust levels never developed About 50 milliseconds after ignition severe thrust chamber motion developed and the second stage began to tumble Telemetry indicated that the first tumble period was about 29 seconds Propellant depletion occurred at MECO plus 212 seconds The nominal first-bum duration was 378 seconds 77 314 ANNA lA 10 May 62 Response Mode Flight Phase After a successful Thor flight an electrical malfunction prevented separation and second-stage ignition 81 240 Asset-2 24 Mar 64 Response Mode Flight Phase The second stage either failed to ignite or burned for only one second 9/10/96 170 [PAGE 180] References Montgomery and Ward A Computations of Hit Probabilities From Launch-Vehicle Debris RTI/4666/02F September 19 1990 Eastern Test Range Directorate of Safety Post-Test Report Test Dl000 18 June 1991 Ward James A Baseline Launch-Area Risks for Atlas and Delta Launches RTI/5180/60/40F September 30 1995 11 Spacelift Effective Capacity Part Launch Vehicle Projected Success Rate Analysis Draft Booz•Allen Hamilton Inc 19 February 1992 prepared for the Air Force Space Command Launch Services Office Launch Options for the Future Special Report Office of Technology Assessment July 1988 Silke Kevin 11 Reliability Growth Model Overview General Dynamics Reliability Bulletin 92-02 Eastern Range Launches 1950 1954 Chronological Summary 45th Space Wing History Office Eastern Range Launches Chronological Summary 45th Space Wing History Office Extension updating the launch summary through 30 December 1995 Vandenberg AFB Launch Summary Headquarters 30th Space Wing Office of History Launch Chronology 1958 1995 10 Isakowitz Steven updated by Jeff Samella International Reference Guide to Space Launch Systems Second Edition published and distributed by AIAA in 1995 11 Smith Launch Systems for Manned Spacecraft Draft July 23 1991 12 Comparison of Orbit Parameters Table prepared by McDonnell Douglas Space Systems Company Delta launches through Nov 95 13 Missiles/Space Vehicle Files 45th Space Wing Wing Safety Mission Flight Control and Analysis SEO 1957 through 1995 14 Missile Launch Operations Logs 30th Space Wing copies provided via ACT A Inc Mr James Baeker 1963 through 1995 9/10/96 171 RTI [PAGE 181] 15 11 Titan IV America's Silent Hero published by Lockheed Martin in Florida Today 13 Nov 95 16 Atlas Program Flight History through April 1965 General Dynamics Report EM-1860 26 April 1965 17 Fenske Atlas Flight Program Summary Lockheed Martin April 1995 18 Brater Bob Launch History Lockheed Martin FAX to-RTI March 13 1996 19 Several USAF Accident/Incident Reports for Atlas and Titan failures 20 Quintero Andrew Launch Failures from the Eastern Range Since 1975 Aerospace memo February 25 1996 provided to RTI by Bill Zelinsky 21 Set of Titan Flight Anomaly Failure Summary since 1959 received from Lockheed Martin April 1996 22 Chang I-Shih Space Launch Vehicle Failures 1984 1995 Aerospace Report No TOR-96(8504)-2 January 1996 9/10/96 172 RTI
Mit KI aus der Originaldatei erstellt — kann Fehler enthalten.
Automatische Übersetzung — das Originaldokument ist auf Englisch. Auf Englisch ansehen →
Quelle: US-Kriegsministerium / AARO — gemeinfrei · war.gov/ufo
Entitäten in diesem Dokument
Verbundene Fälle
Verwandte Fälle

DOW-UAP-D104, Abschließende Personalakte für Newhouse, Delbert C., U.S. Navy, 1957
DOW-UAP-D100, Bericht des Air Materiel Command über unidentifizierte Flugobjekte, 1947-1948
18_100754_ General 1946-7_Vol_2
18_6369445_General_1948_Vol_1
342_HS1-416511228_319.1 Flying Discs 1949
38_143685_box_Incident_Summaries_101-172
Gleiche Aktenserie
DOW-UAP-D003, Einsatzbericht, Arabischer Golf, 2020
DOW-UAP-D004, Einsatzbericht, Arabischer Golf, 2020
DOW-UAP-D005, Einsatzbericht, Arabischer Golf, 2020
DOW-UAP-D006, Einsatzbericht, Arabischer Golf, 2020
DOW-UAP-D007, Einsatzbericht, Arabischer Golf, 2020

DOW-UAP-D008, Einsatzbericht, Dschibuti, 2025
Gleicher Zeitraum
 ▶ 176s
DOW-UAP-PR113, Ungelöster UAP-Bericht, westliche Vereinigte Staaten, 1996
NASA-UAP-D030, STS-80, Bild 1 eines unidentifizierten Objekts, 1996
NASA-UAP-D031, STS-80, Bild 2 eines unidentifizierten Objekts, 1996
NASA-UAP-D032, STS-80, Bild 3 eines unidentifizierten Objekts, 1996
Gleiche Veröffentlichung
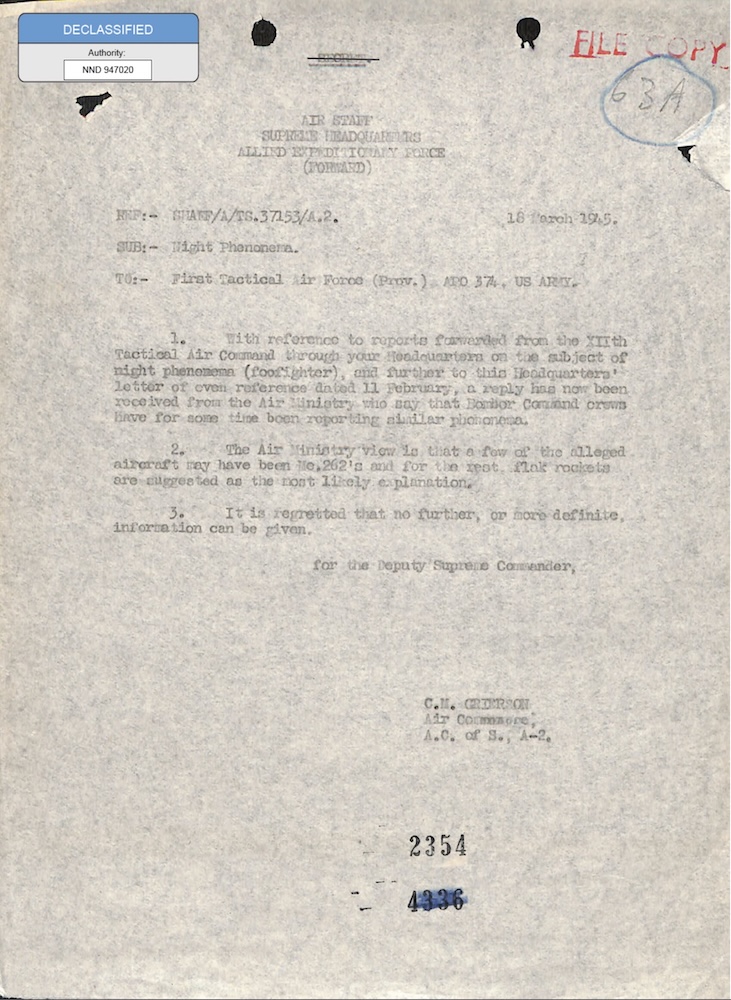
331_120752_Numeric_Files_1944–1945_37153_German_Armament_Equipment_Documents
18_100754_ General 1946-7_Vol_2
18_6369445_General_1948_Vol_1
341_110448_Records_Relating_to_the_Collection_and_Dissemination_of_Intelligence_1948-1955-TS_CONT_No.2_2-5300-2-5399
342_HS1-416511228_319.1 Flying Discs 1949
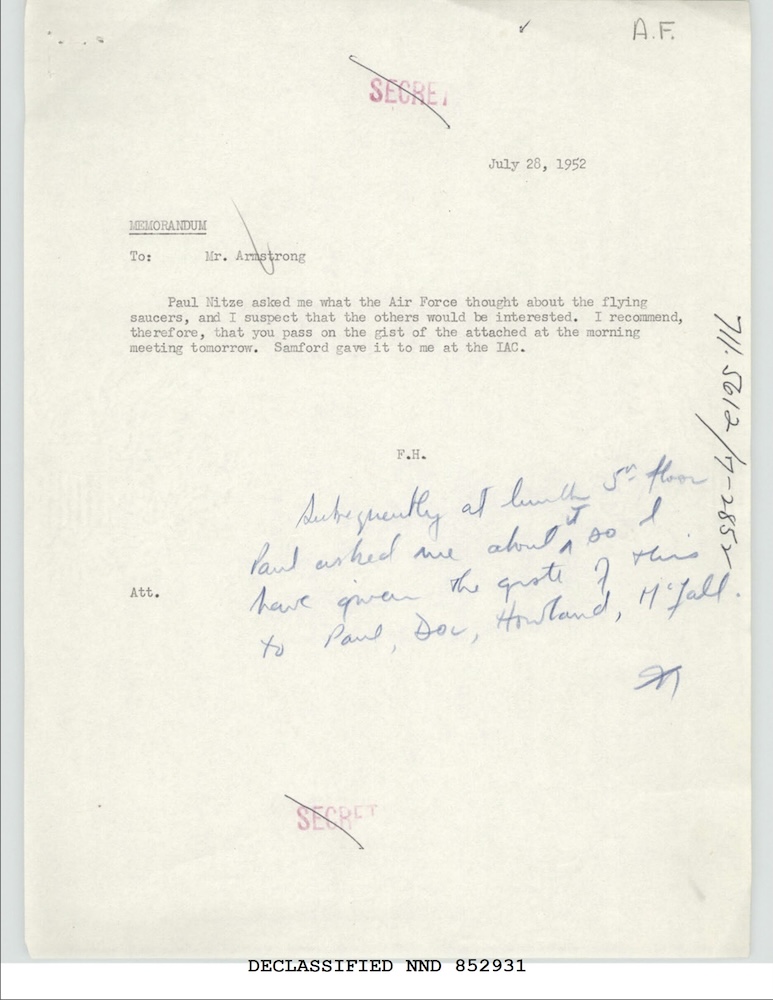
59_64634_711.5612[7-2852
Gleiche Behörde
DOW-UAP-D099, Nachrichtendienstliche Auswertung der „Geisterraketen“-Vorfälle, 1947
DOW-UAP-D100, Bericht des Air Materiel Command über unidentifizierte Flugobjekte, 1947-1948
DOW-UAP-D017, UAP-Meldungen am Sandia-Stützpunkt, 1948–1950
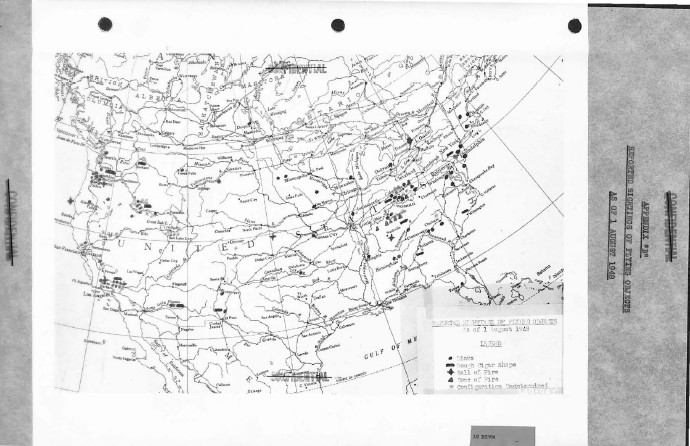
DOW-UAP-D093, Analyse von Vorfällen mit fliegenden Objekten in den Vereinigten Staaten, 1948
DOW-UAP-D097, Fortschrittsbericht zu Project Sign, 1948